
LEVI’S® STADIUM ECONOMIC & FISCAL ANALYSIS (A PRIMARY AND SECONDARY STUDY)
| Study Team: | SportsEconomics, LLC |
| Contacts: | Daniel Rascher, Ph.D. President, SportsEconomics, LLC (510) 387-0644 |
| Date: | September 4, 2023 |
TABLE OF CONTENTS
2.0 Economic Impact Methodologies & Concepts.
2.1 Direct Spending Methodology.
2.2 Indirect and Induced Spending Methodology.
2.3 Multiplier Effect to Measure Indirect and Induced Impacts.
2.4 Fiscal Impact Methodology.
3.0 Measurement of Economic & Fiscal Impact from Nineteen Events at Levi’s Stadium.
3.1 Denver Broncos at San Francisco 49ers (Dec. 9, 2018)
3.2 Seattle Seahawks at San Francisco 49ers (Dec. 16, 2018)
3.3 2018 Pac-12 Championship Football Game (Nov. 30, 2018)
3.4 Redbox Bowl (Dec. 31, 2018)
3.5 2019 College Football Playoff National Championship (Jan. 7, 2019)
3.6 Cleveland Browns at San Francisco 49ers (Oct. 7, 2019)
3.7 Green Bay Packers at San Francisco 49ers (Nov. 24, 2019)
3.8 NFC Championship – Green Bay Packers at San Francisco 49ers (Jan. 19, 2020)
3.9 The Coldplay Concert at Levi’s Stadium (May 15, 2022)
3.10 The Grupo Firme Concert at Levi’s Stadium (July 2, 2022)
3.11 The Red Hot Chili Peppers Concert at Levi’s Stadium (July 29, 2022)
3.12 The Weeknd Concert at Levi’s Stadium (August 27, 2022)
3.13 The Mexico vs. Colombia soccer match at Levi’s Stadium (September 27, 2022)
3.14 The Elton John Concert at Levi’s Stadium (October 8, 2022)
3.15 Kansas City Chiefs at San Francisco 49ers at Levi’s Stadium (October 23, 2022)
3.16 Miami Dolphins at San Francisco 49ers at Levi’s Stadium (December 4, 2022)
3.17 Los Angeles Football Club at San Jose Earthquakes at Levi’s Stadium (May 6, 2023)
3.18 The 2023 CONCACAF Gold Cup at Levi’s Stadium (July 2, 2023)
3.19 Taylor Swift Concerts at Levi’s Stadium (July 28 & 29, 2023)
4.0 Economic Impact of Levi’s Stadium 2023-24 Through July 2023 and since Opening.
4.1 Economic Impact of Levi’s Stadium during 2023-24 Through July 2023.
4.2 Economic Impact of Levi’s Stadium since Opening in Summer 2014.
5.1 Limitations that make the Estimate an Underestimate of True Economic Impact.
5.2 Limitations that make the Estimate an Overestimate of True Economic Impact.
5.3 Other Limiting Conditions.
1.0 Executive Summary
SportsEconomics, LLC (“Research Team”) was retained to evaluate the economic and fiscal benefits to the city of Santa Clara, Santa Clara County, and San José associated with the operations of Levi’s Stadium, its tenants, and each event held there. The study’s key findings are presented in this Executive Summary. The full Report must be read in its entirety, including the limiting conditions provided at the end of the Report, to understand the background, methods and assumptions underlying the study’s findings.
From July 2014 through the end of the July 2023, Levi’s Stadium welcomed approximately 8.7 million people to visit for approximately 155 major events and nearly 1,000 special/corporate events. These events provided substantial impacts to the local community and government agencies. As shown in Exhibit 1.0-1 below, the total economic impact since opening in mid-2014 of Levi’s Stadium on Santa Clara County is over $2 billion, providing nearly $550 million in personal earnings and creating approximately 11,840 FTE jobs.[1] In addition to fueling economic activity in the region that supports jobs and small businesses, nearly $350 million went to the city of Santa Clara and the Santa Clara Stadium Authority in the form of sales and hotel taxes, ticket surcharges, city parking fees, and rent. An additional $120 million has gone to the city of San José and Santa Clara County governments. Moreover, spending by visitors to Levi’s Stadium events, visiting organizations, sponsors, vendors, and by the 49ers organization outside of Santa Clara County (but within the greater Bay Area) has provided over $370 million in additional estimated economic impact.
While not included in the calculation of economic impact, the construction cost of Levi’s Stadium was in the range of $1 billion, and much of those expenditures were spent locally, benefiting the community. Similarly, Levi’s Stadium has been a catalyst for a number of new development projects in the north Santa Clara area, including hotels, residential high rises, and commercial development.
[1] An FTE job is a full-time equivalent job for one year. E.g., two people could have part-time jobs for one year that add up to a single full-time job.
Exhibit 1.0-1
|
Finding # 1 : |
Levi’s Stadium has generated substantial economic impacts on the city of Santa Clara, San José, and Santa Clara County |
|
Finding # 2 : |
Direct Economic Impact: $1.46 billion |
|
Finding # 3 : |
Total Economic Impact: $2.02 billion |
|
Finding # 4 : |
Induced Economic Impact: $546 million in personal earnings and approximately 11,840 FTE jobs |
|
Finding # 5 : |
Incremental Tax & Fee Impact: $469 million |
The economic impact portion of this study evaluates the areas described as follows:
- Direct Spending – This represents dollars spent within the local region related to the events that otherwise would be spent outside the local region’s economy (e.g., non-local spectator spending outside the venue, and event-related spending and revenues that are incremental to the local region).
- Indirect Spending – Indirect Spending results from the re-spending of those “direct” dollars as they circulate through the local economy (commonly referred to as the “multiplier effect”, which is discussed in a subsequent section).
- Total Economic Impact– Total Economic Impact (Output) is equal to the sum of direct and indirect spending.
Direct spending also increases economic activity, which increases resident income levels (associated with new and existing jobs), resulting in additional spending within the local economy, referred to as the induced effect. The Total Economic Impact is inclusive of the induced impacts.
- Induced Economic Impact Affecting Earnings – The direct and indirect increase in resident income levels resulting from direct spending activity related to the events and operations at Levi’s Stadium.
- Induced Economic Impact Affecting Employment – The number of direct and indirect full-time equivalent (FTE) jobs that are supported in the local economy as a result of direct spending activity related to the events and operations at Levi’s Stadium.
- Fiscal Impact – The annual taxes collected as a result of the events and operations and non-local visitors traveling to the local region that would not have accrued to the region if it were not for the presence of the events held at Levi’s Stadium.
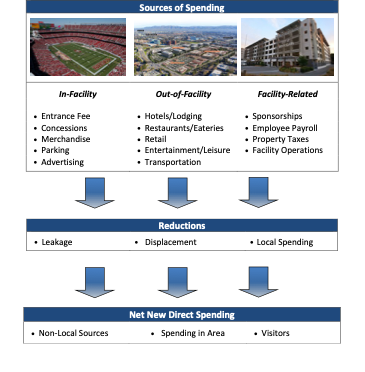
The operations of such events can benefit a community in a variety of ways. Initial rounds of spending are generated by spectators on tickets, concessions, merchandise and parking, as well as before and after the events at local hotel, restaurant, entertainment, retail and other establishments. For events hosted at facilities such as Levi’s Stadium, spending is also generated by the operation of the facility itself, which contributes through its direct expenditures within the community as well as through the taxes paid to the local government.[1] Further, the operations of a facility can generate venue-related spending in areas such as advertising and sponsorships. Although spending originates from local spectators or other local sources, as well as from spectators and sources outside the area (“visitors”), for purposes of this Report, only those sources of initial direct spending that are generated from outside the area or by organizations within the area that would not have spent the money locally otherwise are considered “net new” to the community. Spending by visitors inside of an event may be considered economic impact if the vendors inside of the event are local businesses. Care is taken to avoid double-counting expenditures by visitors that are then re-spent by event organizers in the local community.
Spending by local spectators and revenue generated by local sources is assumed to be entirely displaced. In other words, it is assumed that this spending would have occurred in the local economy in some other form if it were not spent before, during, and after the events. For example, if a local resident did not spend money at one of these events, it is assumed that he would have spent that money on another form of purchase in the local economy, such as for concert or theater tickets, shopping, dining, etc. Therefore, since such spending is not considered new to the local economy, it has not been included in the estimates of economic and fiscal impacts presented in this Report. Similarly, the indirect spending estimates are based on the “adjusted” direct spending figures. Explanations of all findings are contained within the relevant sections of the Report.
As described in Section 5.0 of this Report, there are aspects of economic impact that are difficult to quantify. For instance, sports and cultural events can provide free media coverage for a local region (known as media impact) that can lead to future tourism in the community. Measurements of media impact are beyond the scope of this analysis. Additionally, local events can provide an emotional benefit to residents above and beyond any tangible financial benefit. This is known as psychic impact or public consumption benefit. Valuing this is beyond the scope of this study. However, even though the amount of local spending is not counted as part of economic impact, it does provide information on the entertainment value to local residents of an event, team, or facility.
The analysis provided herein measures the gross economic impact (or economic benefits) of Levi’s Stadium on the surrounding community and does not account for any costs to the community such as from congestion, opportunity costs of having used the land in alternative ways, direct out-of-pocket costs to the local community or local government involving the construction of the facility, hosting events, or any other costs.
Section 2.0 of this Report describes economic impact concepts and the methodology used. Section 3.0 provides the specific findings of economic and fiscal impacts on the eight events, which were measured directly via survey and interviews, on the city of Santa Clara, Santa Clara County, and San José. Section 4.0 uses primary and secondary information from those eight events plus other information to measure the annual impact of Levi’s Stadium. Section 5.0 discusses limitations of the study, including sources of economic impact that are not accounted for, thus making the estimates here conservative.
2.0 Economic Impact Methodologies & Concepts
One purpose of economic impact analysis is to provide the public with relevant information regarding the return on an investment in a project, event, or stadium. The management of financial resources is decided directly by government officials or indirectly by citizen voting. Economic impact provides a metric for comparison to other possible investment projects or events.
Economic impact is based on the theory that a dollar flowing into a local economy from outside of the local economy is a benefit to the locality. In order to measure economic impact, the cause of the impact must first be identified. The most important underlying principle in evaluating economic impact is to measure new economic benefits that accrue to the region that would not have otherwise occurred. While this sounds simple, part of the difficulty lays in measuring what would have happened to the region without the events having taken place, considering that the situation is purely hypothetical.
The financial return for citizens is in the form of new jobs, new earnings, and new tax revenues that occur because of the occurrence of the sporting events and the operation of the stadium, and the generation of business income for locally-owned businesses.[2] These new earnings, for instance, are generated for citizens who are not directly associated with the sporting events or stadium, but who are the beneficiaries of the positive externalities that sports events can provide to communities. Positive externalities, or overflow benefits, are those benefits that are produced by an event or stadium, but are not captured by the event owners or sports facility being used. When a visitor comes to the city of Santa Clara to attend Levi’s Stadium, they may spend money at local food establishments, gas stations, retail stores, etc. This spending benefits the owners and employees of those establishments thereby creating a positive direct economic impact.
An important concept that is determined early in a study is the geographic area of impact. Generally, the geographic region upon which the economic impact is measured is the region that is considering funding part of the sporting event or stadium’s costs. In this way, the proper cost-benefit analysis is performed. If the local government partially funds a sporting event or stadium, then the residents of that geographic region pay for the investment. The correct comparison is to determine the benefits that the city of Santa Clara receives, not some other city, county, or state or combination thereof.
The area of impact is a significant factor in determining the amount of economic impact that occurs. As an example, imagine a resident of Walnut Creek who typically spends her entertainment dollars attending the movies near home. If a sporting event comes to Levi’s Stadium and the resident spends money at the event and in the surrounding areas, but does not attend the movies that same weekend, then the spending that has occurred may not be new spending in the Bay Area (which contains Walnut Creek), but rather substituted, displaced, or redirected spending. However, it will be new spending in the city of Santa Clara. On the other hand, a resident of Sacramento would provide economic impact for the city of Santa Clara or the Bay Area since Sacramento lies outside of the Bay Area, but not for the state of California.
However, if she would have taken those dollars and spent them outside of the state instead, then her spending ought to be counted toward economic impact. Rather than spending their money attending the event in another state, some of those spectators from the city of Santa Clara would “vacation at home” and attend the event in the city of Santa Clara, and that money won’t leave the state. Recent research by Steven Cobb and Douglas Olberding provides evidence that, for some events, spending by local residents ought to be counted toward economic impact because these residents would have spent that money outside of the geographic area attending some other event.[3] In fact, the article states that somewhere close to 20 percent of locals ought to be counted as incremental spenders for larger profile events. Previous studies have found a significant portion (greater than 25%) of local residents would have attended various events in some other state had it not been hosted in their home state.[4] Therefore, the analysis presented here provides a lower-bound estimate of economic impact because no spending by local residents is calculated in the estimate of economic impact.
As discussed, and to provide a conservative estimate, most spending by local residents is considered to be displaced spending and is not counted as part of economic impact. For this reason, it is very important to be able to delineate attendees into visitors and local residents. There is a further delineation of visitors into: (1) visitors who were already in town for another reason, but decided to attend the event anyway (“casual” visitors), (2) visitors who would have come to town during another nearby time period, but instead opted to attend the event during this time period forgoing coming to town another time (“time-switchers”), and (3) visitors who are in town because of the event and would not have come to town otherwise. This latter group constitutes visitors whose spending is fully counted as being part of direct spending economic impact. The spending by “casual” visitors and “time-switchers” is not counted as new spending in this study.[5]
Economic benefit is measured through direct spending, which has two different components. The first component is visitor spending. For example, how much did people spend at these events and during the course of their entire stay on restaurants, retail, transportation, etc.? Another component is organizational spending. How much is spent by event organizers, stadium operators, etc., to run this event, accounting for the source of funding for the event? If the city is partially funding a local event, then those expenditures should not be counted as part of economic impact since the city could have spent that money elsewhere within the city. Care is taken to avoid double-counting of spending by spectators inside of an event coupled with the event organizers spending in town (see Section 2.1 for more details). Some vendors within an event are local businesses and thus spending by visitors on those vendors provides economic impact. However, spending by visitors on vendors who are not local does not necessarily provide local economic impact.
For the purposes of this Report, quantifiable impacts are in the form of economic impacts which are subdivided into three stages of impact: direct, indirect, and induced impacts. These are further sub-divided into total output, earnings or income, employment, and fiscal effects. Descriptions of each term follow.
2.1 Direct Spending Methodology
Direct spending is measured for spending in Santa Clara County (and further disaggregated into the cities of Santa Clara and San José) that would not otherwise occur without the presence of Levi’s Stadium and the events it hosts. This spending will be derived from:
- Visiting spectator spending outside of the events (at local restaurants, retail stores, etc.);
- Visiting athletes/corporations/sponsors/media and other event participants’ spending; and
- Spending due to the operations of Levi’s Stadium.
Each of these expenditure categories are adjusted for spending that occurs outside of Santa Clara County, within the county (but not including the cities of Santa Clara and San José), within the city of Santa Clara, and within the city of San José, based on the location of the lodging of visitors and the relative expenditures on restaurants across the four distinct geographic areas. This Report utilizes primary research (surveys and direct data gathering during the events) to estimate spending, as well as secondary research (the assimilation of data/information that already existed and was created for purposes other than this report) for non-survey based spending categories.
2.2 Indirect and Induced Spending Methodology
The economic output that results from the direct spending during an event subsequently affects many other industries and workers. For instance, when a group of visitors attends an event at Levi’s Stadium, they may spend money in a local restaurant before the event. The restaurant will disburse some of this money to pay employees, to purchase food, to pay utilities, and so on. The food wholesaler will pay the farmer who then purchases clothing at the local retail store. These additional expenditures continue through the successive rounds until the money either leaks out of the local economy or is saved within the local economy for a significant period of time.
The indirect economic impacts are those that occur in the local region or area of impact that is the re-spending of the initial visitor expenditures. Indirect spending arises from the need of one industry to purchase goods or services from other industries to produce its output. When one business that is a direct recipient of event-related spending purchases goods from another business within the local region in order to produce its output, the second business also realizes economic benefit through the “ripple” (or indirect effect) of the initial expenditure. For example, when attendees purchase food at a restaurant, the restaurant must purchase goods from producers/manufacturers in order to maintain inventory levels. To the extent this “re-spending” occurs in the local economy, the initial dollars spent with the restaurant have secondary effects on the local economy. Indirect impacts occur in various industries including: the wholesale industry as purchases of food and merchandise products are made; the transportation industry as the products are shipped from purchaser to buyer; and the manufacturing industry as products used to service the restaurant is produced. The summation of each successive round of re-spending constitutes the indirect impact estimate.
In this study, expenditures made by the event organizer to host and manage the event are included as direct spending. However, the spending by spectators on tickets, participation fees, concessions, merchandise, etc. is not counted toward economic impact because it is often re-spent by the event organizer to host the event. In other words, the cause for the event organizer’s spending is based on the direct revenues it generates from spectators and participants. This allows the analysis to avoid double-counting.
The induced economic impact is the effect of the direct and indirect economic impact on earnings and employment. Induced effects occur when the income levels of residents rise as a result of increased economic activity and a portion of the increased income is re-spent within the local economy. As the initial spending and subsequent re-spending occurs, a portion is retained as income to local residents and employees, and as local, regional, and state taxes. This indirect spending results in increased economic activity, which leads to increases in employment and which increases household income levels and allows for additional household spending (the “induced effect”). These impacts will be reported in terms of employment and earnings impacts.[6]
Some economists choose not to count indirect impacts because other uses of funds would also produce developments that would lead to indirect impacts. Thus, in comparing across multiple investments, it seems redundant to add in indirect impacts. However, the amount of indirect impact varies considerably across the types of industries that are affected. Tourism-related industries typically have higher indirect impacts than manufacturing industries, for instance.
2.3 Multiplier Effect to Measure Indirect and Induced Impacts
As previously noted, direct spending stimulates additional spending, referred to as the indirect effect. Direct spending also increases economic activity, which increases resident income levels (associated with new and existing jobs), resulting in additional spending within the local economies, referred to as the induced effect. These secondary indirect and induced effects are referred to as the “multiplier effects” of the initial direct spending. These effects are measured through the application of economic multipliers, which quantify the extent that dollars introduced to a local or regional economy are re-spent on goods and services within the local economy.
The concept of multipliers is based on the theory that part of a dollar injected into a local economy will be re-spent locally, thereby affecting more than the original recipient of the dollar. Multipliers are derived by tracing the interrelationships of industries within a specified economy to understand the impact that a dollar spent in a given industry has on other industries in that economy. A business that is an initial recipient of new spending will purchase goods and services from other producers. These purchases comprise the indirect effect of the initial expenditure. This process is repeated until subsequent purchases are made from producers that are not a part of the Santa Clara County economy (i.e., a producer imports an input from another city, state, or country) and the flow of money within the county economy ceases (or “leakage” occurs). The businesses, hotels, and organizations that receive the initial direct spending generally re-spend it in five ways:
- With other private sector businesses in the same local economy on inventory, maintenance, etc.;
- With employees who reside in the same local economy as wages, tips, etc.;
- With local government as sales or hotel taxes (Transient Occupancy Tax), or property taxes;
- With non-local governments as sales taxes or taxes on profits;
- With employees, businesses, or organizations who reside outside of the local economy.
The first three items are types of spending that re-circulate throughout the local economy. These last two categories of spending are considered “leakages” outside of the geographic region and reflect the notion that a region is not economically isolated, but engages in commerce with other regions. The larger and more diverse the geographic region, the less leakage there is, all else equal.
Using the above five scenarios, input-output tables are created that disaggregate an economy into industries and examine the flow of goods and services among them. Multipliers are then mathematically derived which uniquely describe the change in output for each and every industry as a result of the injection of one dollar of direct impact into any of those industries. The process allows a separate multiplier to be applied for each of the 528 industry groups.
The size of a given economy’s multiplier is directly related to its geographic size, population and diversity of its industrial and commercial base. A larger population is generally able to support a more diverse economic base and more products are likely to be manufactured and purchased locally. Therefore, money injected into an economy with a larger population is re-spent more often, causing greater changes in local business volume. Conversely, a smaller defined local geographic region implies that more event attendees are visitors, as described above. However, smaller geographic areas suffer from a greater degree of “leakage” because a smaller geographic region is less self-sufficient than a larger region.
In this Report, direct spending is used to estimate indirect spending by using multipliers from a regional economic impact model based on the USDA Forest Service IMPLAN (IMpact Analysis for PLANning), now supplied by IMPLAN (an economics and software firm).[7] IMPLAN produces a report that provides multipliers for over 500 sectors of economic activity at the city, county, region, and state level, using data provided by the U.S. Bureau of Economic Analysis.
The following represents an example of multiplier effects within a locality. If a group of spectators from outside of Santa Clara County visits the county because of an event at Levi’s Stadium and spends $1,000 in the community, or if this money is spent by one of the exhibitors affiliated with an event that is based outside of the county, then this initial direct expenditure stimulates economic activity and creates additional business spending, employment, household income, and government revenue in the county. The initial spending (by the visitor) is called the direct impact and the ripple effect is termed the multiplier effect.[8]
The local theater, restaurants, retail stores, transportation, and others who receive the initial injection of money will spend it in one of the five ways listed above. The remaining portion of the initial spending that does not leak out of the economy is then spent in one of the same five ways and the chain of events continues. The subsequent rounds of spending are termed indirect impacts and stem from the multiplier effect. Exhibit 2-1 shows the direct and indirect effects generated by an injection of spending by incremental visitors to the event.[9]
Exhibit 2.3-1
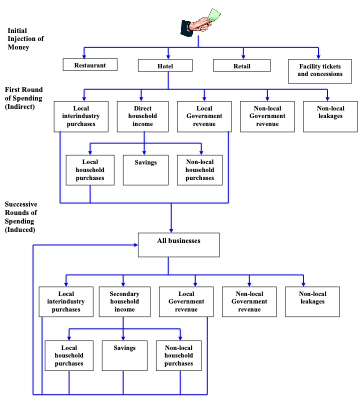
As illustrated, direct spending that occurs from spectators in the venue, spectators outside of the venue, and for athlete/event-related activities fosters additional spending in various industries. This indirect spending results in increased economic activity, which increases household income levels and allows for additional household spending.
There are different types of multipliers and each has a specific purpose. The multipliers are complementary, not additive.
The first type of multiplier is called an output, sales, or transaction multiplier. It measures the direct, indirect, and induced effect of an extra unit of visitor spending on economic activity within a local economy. This multiplier relates tourism expenditure to the increase in business financial turnover that is created. There are 528 industries, each having its own multiplier. In the analysis that follows, the multipliers have been reduced to 39 aggregated industry sectors with the relevant tourism sectors analyzed.
The appropriate multipliers to be used are dependent upon certain regional characteristics and also the nature of the expenditure. We selected multipliers for the following industries, as these industries provide the best representation of initial spending associated with the operations of events: commercial sports, hotels, eating and drinking places, entertainment, retail trade, local transportation, and miscellaneous spending. Three different sets of multipliers are generated by IMPLAN corresponding to measures of regional economic activity, including: total sales, personal income, and jobs. Multipliers for total sales, personal income, and jobs were identified for each of the industries listed above.
An earnings (also known as an income) multiplier, the second type, measures the direct, indirect, and induced effects of an extra unit of visitor spending on the level of household income in the local economy. It is operationalized as the ratio of change in income to the initial autonomous change in expenditure that brings it about. It is the clearest indicator of the effect of economic impact on residents of the local community.
The third type of multiplier is called an employment multiplier. Employment multipliers measure the direct, indirect, and induced effects of an extra unit of visitor spending on employment in the local economy. It measures how many full-time equivalent (FTE) jobs are supported in the local economy as a result of visitor expenditures.
2.4 Fiscal Impact Methodology
In addition to economic impacts, the local governments of the city of Santa Clara, San José, and Santa Clara County (as well as those of other nearby cities, counties and the state of California) benefit from the operations of these events in the form of tax revenues.[10] Further, the city, county, and state will also receive tax revenues due to the operation of the facility itself. Fiscal impacts are measured for the city of Santa Clara, San José, and Santa Clara County and are calculated by analyzing the marginal tax rates for each category in relation to direct impacts. Indirect impacts are measured by using recent historical aggregate average tax rates collected by the local government.
Fiscal information used in this analysis was obtained from the California Department of Tax and Fee Administration, city of Santa Clara, city of San José Finance Department, California Legislature, San José Airport, San Francisco 49ers, and other resources. The primary taxes affected by event-related expenditures include the Sales and Use Tax (for the city of Santa Clara, San José, and Santa Clara County), Transient Occupancy Tax (for all three jurisdictions), Community Facilities District Tax (City of Santa Clara), Car Rental Tax (San José), Convention Center Facilities District Fee (San José), Hotel Business Improvement District Fee (San José), Ticket Surcharge (Santa Clara Stadium Authority [SCSA]), and City Parking Fees (the city of Santa Clara). The following is a brief discussion of these taxes and fees.
Sales Tax
Santa Clara County levies a sales and use tax of 1.75 percent, with the city of San José charging 1.25 percent, and the city of Santa Clara charging 1.00 percent on tangible items.
Transient Occupancy Tax
The city of Santa Clara charges hotel taxes totaling 15.5 percent. Of the 15.5 percent, 11.5 percent is a Transient Occupancy Tax (TOT), 2 percent is the Community Facilities District (CFD) Tax due to the formation of the CFD, and 2 percent is the Santa Clara Tourism Improvement District (SCTID) assessment. This CFD includes hotel properties in the vicinity of Levi’s Stadium. The SCTID is for 11 hotels located near the Santa Clara Convention Center (near Levi’s Stadium).[11] Santa Clara County charges a Transient Occupancy Tax of 8 percent. Additionally, San José charges a 10 percent TOT and Hotel Business Improvement District Fee that ranges from $1.00 per room-night to $3.00, and a Convention Center Facilities District Fee of 4 percent.
Motor Vehicle Rental Tax
Only the city of San José charges a rental car tax which is 10%.
Ticket Surcharge and City Parking Fees
SCSA collects 10% of NFL ticket revenue at Levi’s Stadium, $0.35 per ticket for Senior and Youth Programs, and $4 per ticket for non-NFL events. City parking fees are collected at city-owned and privately-owned lots during events at Levi’s Stadium.
Other Taxes
In addition to the above major taxes affected by venue events noted above, other governmental jurisdictions, including the state, will realize additional event-related tax revenues such as a fuel tax and others.
These taxes and corresponding tax rates provide the basis to calculate fiscal impact from direct and indirect revenues as a result of stadium operations. Indirect fiscal impact is based on the average (not marginal) taxes collected for each dollar spent within each governmental jurisdiction.
3.0 Measurement of Economic & Fiscal Impact from Nineteen Events at Levi’s Stadium
The analysis described in this section is primarily based on the surveys administered during and after nineteen (19) key events at Levi’s Stadium:
- Denver Broncos at San Francisco 49ers (Dec. 9, 2018),
- Seattle Seahawks at San Francisco 49ers (Dec. 16, 2018),
- 2018 Pac-12 Championship football game between the Washington Huskies and the Utah Utes (Nov. 30, 2018),
- Redbox Bowl college football game between the Michigan State Spartans and Oregon Ducks (Dec. 31, 2018),
- 2019 College Football Playoff National Championship (CFP) between the Clemson Tigers and Alabama Crimson Tide (Jan. 7, 2019),
- Cleveland Browns at San Francisco 49ers (Oct. 7, 2019),
- Green Bay Packers at San Francisco 49ers (Nov. 24, 2019),
- The 2019 NFC Championship Game between the Green Bay Packers and San Francisco 49ers (Jan. 19, 2020),
- Coldplay Concert (May 15, 2022),
- Grupo Firme Concert (Jul. 2, 2022),
- Red Hot Chili Peppers Concert (Jul. 29, 2022),
- The Weeknd Concert (Aug. 27, 2022),
- Mexico versus Columbia Men’s Soccer Match (Sep. 27, 2022),
- Elton John Concert (Oct. 8, 2022),
- Kansas City Chiefs at San Francisco 49ers (Oct. 23, 2022),
- Miami Dolphins at San Francisco 49ers (Dec. 4, 2022),
- Los Angeles Football Club at San Jose Earthquakes (May 6, 2023),
- CONCACAF Gold Cup Soccer Matches (July 2, 2023),
- Taylor Swift Concerts (July 28 & 29, 2023).
Post-game electronic surveys were administered for each event except the CFP event, which instead involved direct intercept surveying of attendees prior to the event.
3.1 Denver Broncos at San Francisco 49ers (Dec. 9, 2018)
Just after the game, an electronic survey was emailed to attendees, resulting in 1,438 valid responses, representing 3,661 people. The resulting measurement error in the results that follow is 1.7%.[12] The economic impact measurements based on this survey are described in this section. Additionally, there were impacts from the visiting team, media (both reporting the event and producing the event), vendors, sponsors, and the 49ers organization.
As noted, an important component of direct spending includes fan expenditures outside event venues at local establishments such as restaurants, retail shops and other such places. Survey respondents were asked their location of residence, reason for their visit, and about the level and types of activities for which they spend their money in order to develop an estimate regarding the level of fan spending before and after events. As discussed previously, economic impact is generated only when “new” money is injected into the local economy. In other words, economic impact is considered net spending that would not have occurred if not for the events hosted locally at the stadium. To quantify this amount, spending was only included for attendees who met four conditions:
- Attendees must live outside of Santa Clara County in order to generate “new” spending for the county;
- Attending the event must have been the primary purpose for traveling to the area;
- Attending the event must not have replaced another trip to attend an event in Santa Clara County; and
- Sufficient spending and party size information must have been included.
As described in Section 2.0, the economic impact of the event is derived from new spending in the local region, mostly due to from visitors to the community. These sources of revenue are new to the community and do not come from local residents, but from those outside of the community. Finally, the operations of these events also generate spending within the area of impact. The expenditures by event organizers that are captured within the county are included in the total economic impact. Impacts are in the form of total output, earnings, and employment and begin with direct spending, followed by indirect and fiscal impacts.
3.11 Direct and Indirect Spending
Organizational spending and visitor spending at local restaurants, retail stores, and other relevant establishments constitute the direct impacts in this Report. Exhibit 3-1 shows the sources of direct operations impact and various adjustments made to account for re-directed spending, as opposed to new spending, and leakages outside of the area of impact.
Exhibit 3.1-1
Each set of sample data is extrapolated up to its corresponding population in order to obtain direct spending estimates for each of the primary spending categories listed above. The amount of incremental visitor spending is calculated by determining the total number of incremental visitors in the population (not local residents or casual visitors), and then taking a weighted average of those individuals’ spending, per person, per day. From this, we can determine the proportions of spending that were allocated to each of the spending categories, such as lodging, transportation, dining, etc. These relative proportional spending figures can be used to extrapolate the amount of spending that occurred in each of these spending categories during the events being measured. The fiscal impact is based on the tax and parking fees sources described in Section 2.0.
3.12 Direct and Indirect Spending: Santa Clara County
Attendee Survey
Of the survey respondents, 63 percent were visitors to Santa Clara County who came specifically for the game and their trip did not replace another visit. The average size of the paying party represented in each survey is 2.62 for incremental visitors.[13] The average length of stay for each incremental visitor in the county was 1.66 days. The typical incremental visitor spent $122 per day leading to $203 in spending for the entire trip to Santa Clara County.
Based on these findings from the survey analysis, the total direct expenditures by incremental visitors to Santa Clara County are $6.32 million, as shown in Exhibit 3.1-2 below.
Exhibit 3.1-2
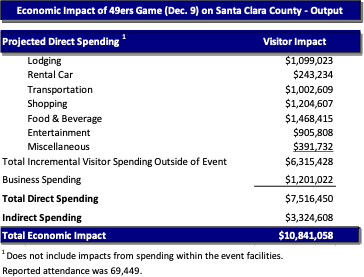
New incremental indirect spending is about $3.3 million. Total economic impact, in terms of output, from incremental visitors is approximately $10.8 million on Santa Clara County because of the December 9, 2018 49ers game. All measurements account for incremental visitor spending, not local resident spending that is above and beyond what they would have spent if not for this event taking place.
Earnings and Employment
Portions of the initial round of spending from the direct economic impact goes to pay employees and others directly as earnings (see Section 2.2 above for an explanation of the methodology). As shown in Exhibit 3.1-3, incremental earnings of nearly $2.9 million and the equivalent of about 60 FTE jobs are created from the initial spending in the local community.
Exhibit 3.1-3

Fiscal Impact
The new incremental direct tax and fee impact of the December 9, 2018 49ers game on the city of Santa Clara, city of San José, and Santa Clara County is based on the various tax rates and fees described in Section 2.4. In addition to economic impacts to local businesses, these local governments benefit from the operations of these events in the form of tax revenues and fees. Exhibit 3.1-4 shows the various local taxes and fees relevant for this analysis. Though other fiscal impacts were generated as a result of this spending, only the tax and fee categories detailed below are measured in this report.
Exhibit 3.1-4
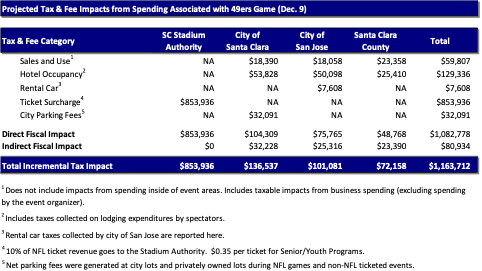
Direct taxes and fees on the aforementioned tax categories are about $854 thousand to SCSA, $104 thousand in the city of Santa Clara, $76 thousand in San José, and $49 thousand in Santa Clara County because of the game. Additionally, taxes are collected on the indirect spending that occurs because of the event. These total (across the three jurisdictions) nearly $81 thousand and are based on the average taxes collected compared with spending that takes place within the three jurisdictions. Overall, the total fiscal impact is over $1.16 million.[14]
3.2 Seattle Seahawks at San Francisco 49ers (Dec. 16, 2018)
Just after the game, an electronic survey was emailed to attendees, resulting in 1,235 valid responses, representing 3,147 people. The resulting measurement error in the results that follow is 1.8%.[15] The economic impact measurements based on this survey are described in this section. Additionally, there were impacts from the visiting team, media (both reporting the event and producing the event), vendors, sponsors, and the 49ers organization.
3.21 Direct and Indirect Spending: Santa Clara County
Attendee Survey
Of the survey respondents, 59 percent were visitors to Santa Clara County who came specifically for the game and their trip did not replace another visit. The average size of the paying party represented in each survey is 2.61 for incremental visitors.[16] The average length of stay for each incremental visitor in the county was 1.65 days. The typical incremental visitor spent $107 per day leading to $177 in spending for the entire trip to Santa Clara County.
Based on these findings from the survey analysis, the total direct expenditures by incremental visitors to Santa Clara County are $4.38 million, as shown in Exhibit 3.2-1 below.
Exhibit 3.2-1
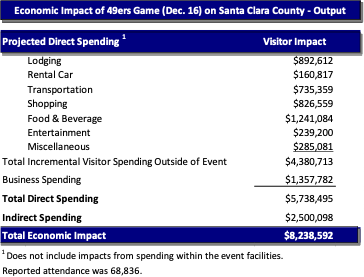
New incremental indirect spending is about $2.5 million. Total economic impact, in terms of output, from incremental visitors is approximately $8.2 million on Santa Clara County because of the December 16, 2018 49ers game. All measurements account for incremental visitor spending, not local resident spending that is above and beyond what they would have spent if not for this event taking place.
Earnings and Employment
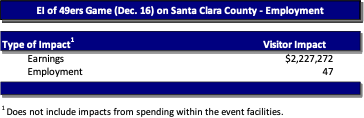
Portions of the initial round of spending from the direct economic impact goes to pay employees and others directly as earnings (see Section 2.2 above for an explanation of the methodology). As shown in Exhibit 3.2-2, incremental earnings of nearly $2.2 million and the equivalent of about 47 FTE jobs are created from the initial spending in the local community.
Exhibit 3.2-2
Fiscal Impact
The new incremental direct tax and fee impact of the December 16, 2018 49ers game on the city of Santa Clara, city of San José, and Santa Clara County is based on the various tax rates described in Section 2.4. In addition to economic impacts to local businesses, these local governments benefit from the operations of these events in the form of tax and fee revenues. Exhibit 3.2-3 shows the various local taxes relevant for this analysis. Though other fiscal impacts were generated as a result of this spending only the tax and fee categories detailed below are measured in this report.
Exhibit 3.2-3
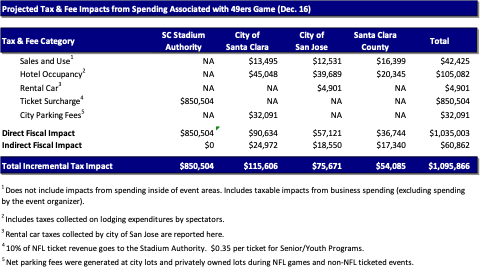
Direct taxes and fees on the aforementioned tax categories are about $851 thousand to SCSA, $91 thousand in the city of Santa Clara, $57 thousand in San José, and $37 thousand in Santa Clara County because of the game. Additionally, taxes are collected on the indirect spending that occurs because of the event. These total (across the three jurisdictions) about $61 thousand and are based on the average taxes collected compared with spending that takes place within the three jurisdictions. Overall, the total fiscal impact is nearly $1.10 million.[17]
3.3 2018 Pac-12 Championship Football Game (Nov. 30, 2018)
Just after the game, an electronic survey was emailed to attendees, resulting in 406 valid responses, representing 1,191 people. The resulting measurement error in the results that follow is 2.9%.[18] The economic impact measurements based on this survey are described in this section. Additionally, there were impacts from the participating teams, media (both reporting the event and producing the event), vendors, sponsors, and the Pac-12 organization.
3.31 Direct and Indirect Spending: Santa Clara County
Attendee Survey
Of the survey respondents, 61 percent were visitors to Santa Clara County who came specifically for the game and their trip did not replace another visit. The average size of the paying party represented in each survey is 3.17 for incremental visitors.[19] The average length of stay for each incremental visitor in the county was 2.04 days. The typical incremental visitor spent $117 per day leading to $238 in spending for the entire trip to Santa Clara County.
Based on these findings from the survey analysis, the total direct expenditures by incremental visitors to Santa Clara County are $2.43 million, as shown in Exhibit 3.3-1 below.
Exhibit 3.3-1
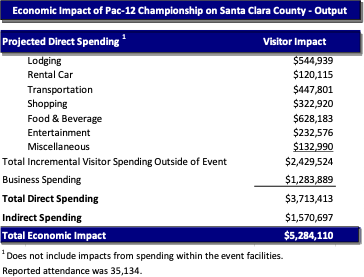
New incremental indirect spending is about $1.6 million. Total economic impact, in terms of output, from incremental visitors is approximately $5.3 million on Santa Clara County because of the November 30, 2018 Pac-12 Championship game. All measurements account for incremental visitor spending, not local resident spending that is above and beyond what they would have spent if not for this event taking place.
Earnings and Employment
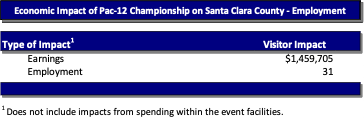
Portions of the initial round of spending from the direct economic impact goes to pay employees and others directly as earnings (see Section 2.2 above for an explanation of the methodology). As shown in Exhibit 3.3-2, incremental earnings of nearly $1.5 million and the equivalent of about 31 FTE jobs are created from the initial spending in the local community.
Exhibit 3.3-2
Fiscal Impact
The new incremental direct tax and fee impact of the November 30, 2018 Pac-12 Championship game on the city of Santa Clara, city of San José, and Santa Clara County is based on the various tax rates described in Section 2.4. In addition to economic impacts to local businesses, these local governments benefit from the operations of these events in the form of tax and fee revenues. Exhibit 3.3-3 shows the various local taxes relevant for this analysis. Though other fiscal impacts were generated as a result of this spending only the tax and fee categories detailed below are measured in this report.
Exhibit 3.3-3
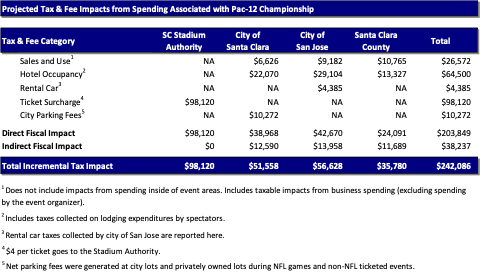
Direct taxes and fees on the aforementioned tax categories are about $98 thousand to SCSA, $39 thousand in the city of Santa Clara, $43 thousand in San José, and $24 thousand in Santa Clara County because of the game. Additionally, taxes are collected on the indirect spending that occurs because of the event. These total (across the three jurisdictions) about $38 thousand and are based on the average taxes collected compared with spending that takes place within the three jurisdictions. Overall, the total fiscal impact is over $242 thousand.[20]
3.4 Redbox Bowl (Dec. 31, 2018)
Just after the game, an electronic survey was emailed to attendees, resulting in 317 valid responses, representing 1,171 people. The resulting measurement error in the results that follow is 2.9%.[21] The economic impact measurements based on this survey are described in this section. Additionally, there were impacts from the participating teams, media (both reporting the event and producing the event), vendors, sponsors, and the event operator.
3.41 Direct and Indirect Spending: Santa Clara County
Attendee Survey
Of the survey respondents, 66 percent were visitors to Santa Clara County who came specifically for the game and their trip did not replace another visit. The average size of the paying party represented in each survey is 3.09 for incremental visitors.[22] The average length of stay for each incremental visitor in the county was 1.89 days. The typical incremental visitor spent $114 per day leading to $215 in spending for the entire trip to Santa Clara County.
Based on these findings from the survey analysis, the total direct expenditures by incremental visitors to Santa Clara County are $2.01 million, as shown in Exhibit 3.4-1 below.
Exhibit 3.4-1
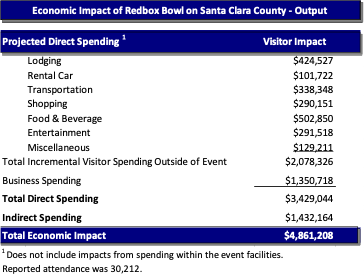
New incremental indirect spending is about $1.4 million. Total economic impact, in terms of output, from incremental visitors is approximately $4.9 million on Santa Clara County because of the December 31, 2018 Redbox Bowl. All measurements account for incremental visitor spending, not local resident spending that is above and beyond what they would have spent if not for this event taking place.
Earnings and Employment
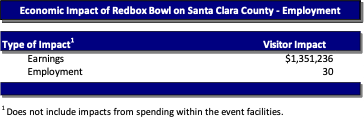
Portions of the initial round of spending from the direct economic impact goes to pay employees and others directly as earnings (see Section 2.2 above for an explanation of the methodology). As shown in Exhibit 3.4-2, incremental earnings of nearly $1.4 million and the equivalent of about 30 FTE jobs are created from the initial spending in the local community.
Exhibit 3.4-2
Fiscal Impact
The new incremental direct tax impact of the December 31, 2018 Redbox Bowl on the city of Santa Clara, city of San José, and Santa Clara County is based on the various tax rates described in Section 2.4. In addition to economic impacts to local businesses, these local governments benefit from the operations of these events in the form of tax revenues. Exhibit 3.4-3 shows the various local taxes relevant for this analysis. Though other fiscal impacts were generated as a result of this spending only the tax categories detailed below are measured in this report.
Exhibit 3.4-3
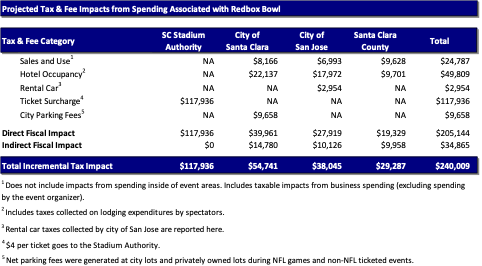
Direct taxes and fees on the aforementioned tax categories are about $118 thousand on SCSA, $40 thousand in the city of Santa Clara, $28 thousand in San José, and $19 thousand in Santa Clara County because of the game. Additionally, taxes are collected on the indirect spending that occurs because of the event. These total (across the three jurisdictions) about $35 thousand and are based on the average taxes collected compared with spending that takes place within the three jurisdictions. Overall, the total fiscal impact is about $240 thousand.[23]
3.5 2019 College Football Playoff National Championship (Jan. 7, 2019)
Prior to the game, surveys were administered in person to those attending the game, resulting in 619 valid responses, representing 1,445 people. The resulting measurement error in the results that follow is 2.6%.[24] The economic impact measurements based on this survey are described in this section. Additionally, there were impacts from the participating teams, media (both reporting the event and producing the event), vendors, sponsors, and the event operator.
3.51 Direct and Indirect Spending: Santa Clara County
Attendee Survey
Of the survey respondents, 70 percent were visitors to Santa Clara County who came specifically for the game and their trip did not replace another visit. The average size of the paying party represented in each survey is 2.25 for incremental visitors.[25] The average length of stay for each incremental visitor in the county was 3.88 days. The typical incremental visitor spent $295 per day leading to $1,143 in spending for the entire trip to Santa Clara County.Based on these findings from the survey analysis, the total direct expenditures by incremental visitors to Santa Clara County are nearly $32 million, as shown in Exhibit 3.5-1 below.
Exhibit 3.5-1
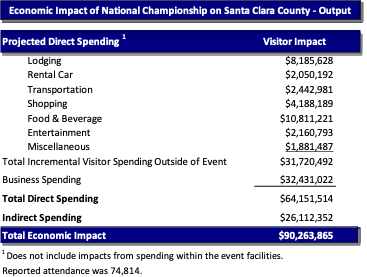
New incremental indirect spending is about $26 million. Total economic impact, in terms of output, from incremental visitors is approximately $90.3 million on Santa Clara County because of the 2019 College Football Playoff National Championship. All measurements account for incremental visitor spending, not local resident spending that is above and beyond what they would have spent if not for this event taking place.
Earnings and Employment
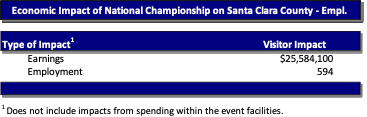
Portions of the initial round of spending from the direct economic impact goes to pay employees and others directly as earnings (see Section 2.2 above for an explanation of the methodology). As shown in Exhibit 3.5-2, incremental earnings of nearly $25.6 million and the equivalent of about 594 FTE jobs are created from the initial spending in the local community.
Exhibit 3.5-2
Fiscal Impact
The new incremental direct tax impact of the 2019 College Football Playoff National Championship on the city of Santa Clara, city of San José, and Santa Clara County is based on the various tax rates described in Section 2.4. In addition to economic impacts to local businesses, these local governments benefit from the operations of these events in the form of tax revenues. Exhibit 3.5-3 shows the various local taxes relevant for this analysis. Though other fiscal impacts were generated as a result of this spending only the tax categories detailed below are measured in this report.
Exhibit 3.5-3
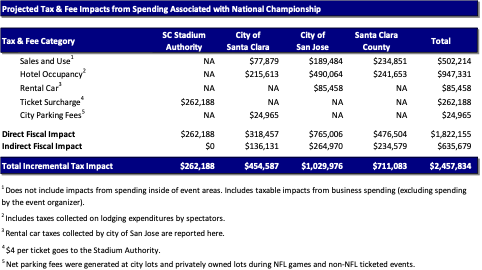
Direct taxes and fees on the aforementioned tax categories are about $262 thousand on SCSA, $318 thousand in the city of Santa Clara, $765 thousand in San José, and $477 thousand in Santa Clara County because of the game. Additionally, taxes are collected on the indirect spending that occurs because of the event. These total (across the three jurisdictions) about $636 thousand and are based on the average taxes collected compared with spending that takes place within the three jurisdictions. Overall, the total fiscal impact is about $2.46 million.[26]
Additionally, and not part of the calculations above, the College Football Playoff National Championship donated $1 million to support teachers in the Bay Area.
3.6 Cleveland Browns at San Francisco 49ers (Oct. 7, 2019)
Just after the game, an electronic survey was emailed to attendees, resulting in 1,053 valid responses, representing 2,611 people. The resulting measurement error in the results that follow is 2.1%.[27] The economic impact measurements based on this survey are described in this section. Additionally, there were impacts from the visiting team, media (both reporting the event and producing the event), vendors, sponsors, and the 49ers organization.
3.61 Direct and Indirect Spending: Santa Clara County
Attendee Survey
Of the survey respondents, 57 percent were visitors to Santa Clara County who came specifically for the game and their trip did not replace another visit. The average size of the paying party represented in each survey is 2.45 for incremental visitors.[28] The average length of stay for each incremental visitor in the county was 2.17 days. The typical incremental visitor spent $131 per day leading to $284 in spending for the entire trip to Santa Clara County.
Based on these findings from the survey analysis, the total direct expenditures by incremental visitors to Santa Clara County are $8.20 million, as shown in Exhibit 3.6-1 below.
Exhibit 3.6-1
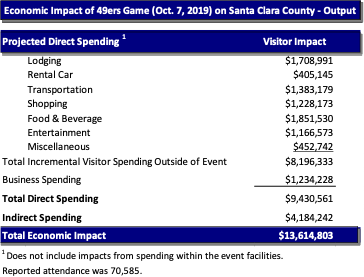
New incremental indirect spending is about $4.2 million. Total economic impact, in terms of output, from incremental visitors and other incremental spending is approximately $13.6 million on Santa Clara County because of the October 7, 2019 49ers game. All measurements account for incremental visitor spending, not local resident spending that is above and beyond what they would have spent if not for this event taking place.
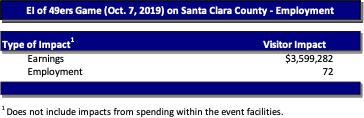
Earnings and Employment
Portions of the initial round of spending from the direct economic impact goes to pay employees and others directly as earnings (see Section 2.2 above for an explanation of the methodology). As shown in Exhibit 3.6-2, incremental earnings of nearly $3.6 million and the equivalent of about 72 FTE jobs are created from the initial spending in the local community.
Exhibit 3.6-2
Fiscal Impact
The new incremental direct tax and fee impact of the October 7, 2019 49ers game on the city of Santa Clara, city of San José, and Santa Clara County is based on the various tax rates described in Section 2.4. In addition to economic impacts to local businesses, these local governments benefit from the operations of these events in the form of tax and fee revenues. Exhibit 3.6-3 shows the various local taxes relevant for this analysis. Though other fiscal impacts were generated as a result of this spending only the tax and fee categories detailed below are measured in this report.
Exhibit 3.6-3
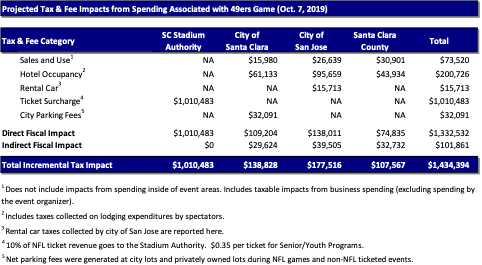
Direct taxes and fees on the aforementioned tax categories are about $1.01 million to SCSA, $109 thousand in the city of Santa Clara, $138 thousand in San José, and $75 thousand in Santa Clara County because of the game. Additionally, taxes are collected on the indirect spending that occurs because of the event. These total (across the three jurisdictions) about $102 thousand and are based on the average taxes collected compared with spending that takes place within the three jurisdictions. Overall, the total fiscal impact is over $1.43 million.[29]
3.7 Green Bay Packers at San Francisco 49ers (Nov. 24, 2019)
Just after the game, an electronic survey was emailed to attendees, resulting in 965 valid responses, representing 2,386 people. The resulting measurement error in the results that follow is 2.3%.[30] The economic impact measurements based on this survey are described in this section. Additionally, there were impacts from the visiting team, media (both reporting the event and producing the event), vendors, sponsors, and the 49ers organization.
3.71 Direct and Indirect Spending: Santa Clara County
Attendee Survey
Of the survey respondents, 58 percent were visitors to Santa Clara County who came specifically for the game and their trip did not replace another visit. The average size of the paying party represented in each survey is 2.51 for incremental visitors.[31] The average length of stay for each incremental visitor in the county was 1.84 days. The typical incremental visitor spent $164 per day leading to $302 in spending for the entire trip to Santa Clara County.
Based on these findings from the survey analysis, the total direct expenditures by incremental visitors to Santa Clara County are $10.00 million, as shown in Exhibit 3.7-1 below.
Exhibit 3.7-1
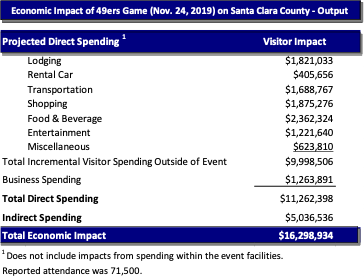
New incremental indirect spending is about $5.0 million. Total economic impact, in terms of output, from incremental visitors and other incremental spending is approximately $16.3 million on Santa Clara County because of the November 24, 2019 49ers game. All measurements account for incremental visitor spending, not local resident spending that is above and beyond what they would have spent if not for this event taking place.
Earnings and Employment
Portions of the initial round of spending from the direct economic impact goes to pay employees and others directly as earnings (see Section 2.2 above for an explanation of the methodology). As shown in Exhibit 3.7-2, incremental earnings of nearly $4.3 million and the equivalent of about 86 FTE jobs are created from the initial spending in the local community.
Exhibit 3.7-2

Fiscal Impact
The new incremental direct tax and fee impact of the November 24, 2019 49ers game on the city of Santa Clara, city of San José, and Santa Clara County is based on the various tax rates described in Section 2.4. In addition to economic impacts to local businesses, these local governments benefit from the operations of these events in the form of tax and fee revenues. Exhibit 3.7-3 shows the various local taxes relevant for this analysis. Though other fiscal impacts were generated as a result of this spending only the tax and fee categories detailed below are measured in this report.
Exhibit 3.7-3

Direct taxes and fees on the aforementioned tax categories are about $1.37 million to SCSA, $140 thousand in the city of Santa Clara, $132 thousand in San José, and $78 thousand in Santa Clara County because of the game. Additionally, taxes are collected on the indirect spending that occurs because of the event. These total (across the three jurisdictions) about $123 thousand and are based on the average taxes collected compared with spending that takes place within the three jurisdictions. Overall, the total fiscal impact is over $1.84 million.[32]
3.8 NFC Championship – Green Bay Packers at San Francisco 49ers (Jan. 19, 2020)
Just after the game, an electronic survey was emailed to attendees, resulting in 1,381 valid responses, representing 3,251 people. The resulting measurement error in the results that follow is 1.8%.[33] The economic impact measurements based on this survey are described in this section. Additionally, there were impacts from the visiting team, media (both reporting the event and producing the event), vendors, sponsors, and the 49ers organization.
3.81 Direct and Indirect Spending: Santa Clara County
Attendee Survey
Of the survey respondents, 58 percent were visitors to Santa Clara County who came specifically for the game and their trip did not replace another visit. The average size of the paying party represented in each survey is 2.43 for incremental visitors.[34] The average length of stay for each incremental visitor in the county was 1.59 days. The typical incremental visitor spent $150 per day leading to $238 in spending for the entire trip to Santa Clara County.
Based on these findings from the survey analysis, the total direct expenditures by incremental visitors to Santa Clara County are $8.01 million, as shown in Exhibit 3.8-1 below.
Exhibit 3.8-1
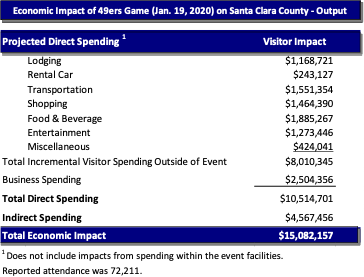
New incremental indirect spending is about $4.6 million. Total economic impact, in terms of output, from incremental visitors and other incremental spending is approximately $15.1 million on Santa Clara County because of the January 19, 2020 NFC Championship game. All measurements account for incremental visitor spending, not local resident spending that is above and beyond what they would have spent if not for this event taking place.
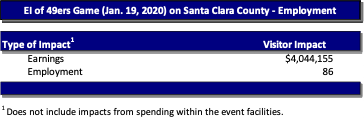
Earnings and Employment
Portions of the initial round of spending from the direct economic impact goes to pay employees and others directly as earnings (see Section 2.2 above for an explanation of the methodology). As shown in Exhibit 3.8-2, incremental earnings of nearly $4.0 million and the equivalent of about 86 FTE jobs are created from the initial spending in the local community.
Exhibit 3.8-2
Fiscal Impact
The new incremental direct tax and fee impact of the January 19, 2020 NFC Championship game on the city of Santa Clara, city of San José, and Santa Clara County is based on the various tax rates described in Section 2.4. In addition to economic impacts to local businesses, these local governments benefit from the operations of these events in the form of tax and fee revenues. Exhibit 3.8-3 shows the various local taxes relevant for this analysis. Though other fiscal impacts were generated as a result of this spending only the tax and fee categories detailed below are measured in this report. There is no ticket surcharge generated at NFL playoff games, thus the exhibit below does not include a column for Santa Clara Stadium Authority like the regular season games above.
Exhibit 3.8-3
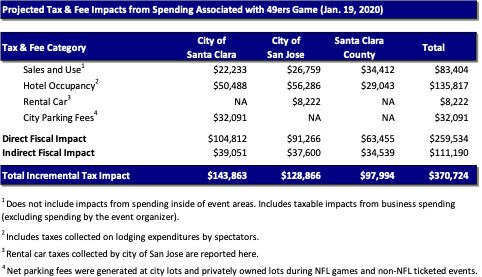
Direct taxes and fees on the aforementioned tax categories are about $105 thousand in the city of Santa Clara, $91 thousand in San José, and $63 thousand in Santa Clara County because of the game.[35] Additionally, taxes are collected on the indirect spending that occurs because of the event. These total (across the three jurisdictions) about $111 thousand and are based on the average taxes collected compared with spending that takes place within the three jurisdictions. Overall, the total fiscal impact is about $371 thousand.[36]
3.9 The Coldplay Concert at Levi’s Stadium (May 15, 2022)
The analysis described in this section is primarily based on the surveys administered after the Coldplay concert that took place at Levi’s Stadium on May 15, 2022. Just after the event, an electronic survey was emailed to attendees, resulting in 1,447 valid responses, representing 3,206 people. The resulting measurement error in the results that follow is 1.8%.[37] The economic impact measurements based on this survey are described in this section. Additionally, there were impacts from the visiting artists, and the 49ers organization.
3.91 Direct and Indirect Spending: Santa Clara County
Attendee Survey
Of the survey respondents, 56 percent were visitors to Santa Clara County who came specifically for the event and their trip did not replace another visit. The average size of the paying party represented in each survey is 2.30 for incremental visitors.[38] The average length of stay for each incremental visitor in the county was 1.51 days. The typical incremental visitor spent $126 per day leading to $191 in spending for the entire trip to Santa Clara County.
Based on these findings from the survey analysis, the total direct expenditures by incremental visitors to Santa Clara County are $2.75 million, as shown in Exhibit 3.9-1 below.
Exhibit 3.9-1
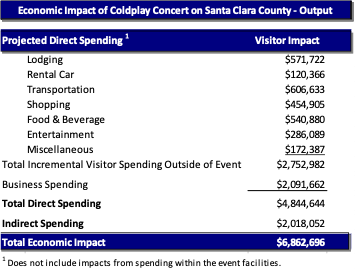
New incremental indirect spending is about $2.0 million. Total economic impact, in terms of output, from incremental visitors is approximately $6.9 million on Santa Clara County because of the May 15, 2022 Coldplay concert. All measurements account for incremental visitor spending, not local resident spending that is above and beyond what they would have spent if not for this event taking place.
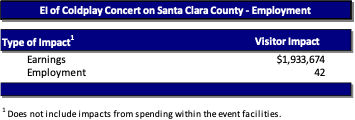
Earnings and Employment
Portions of the initial round of spending from the direct economic impact goes to pay employees and others directly as earnings (see Section 2.2 above for an explanation of the methodology). As shown in Exhibit 3.9-2, incremental earnings of approximately $1.9 million and the equivalent of about 42 FTE jobs are created from the initial spending in the local community.
Exhibit 3.9-2
Fiscal Impact
The new incremental direct tax and fee impact on the city of Santa Clara, city of San José, and Santa Clara County is based on the various tax rates and fees described in Section 2.4. In addition to economic impacts to local businesses, these local governments benefit from the operations of these events in the form of tax revenues and fees. Exhibit 3.9-3 shows the various local taxes and fees relevant for this analysis. Though other fiscal impacts were generated as a result of this spending, only the tax and fee categories detailed below are measured in this report.
Exhibit 3.9-3

Direct taxes and fees on the aforementioned tax categories are about $202,000 to SCSA, $84,000 in the city of Santa Clara, $37,000 in San José, and $29,000 in Santa Clara County because of the concert. Additionally, taxes are collected on the indirect spending that occurs because of the event. These total (across the three jurisdictions) more than $49,000 and are based on the average taxes collected compared with spending that takes place within the three jurisdictions. Overall, the total fiscal impact is nearly $402,000.[39]
3.10 The Grupo Firme Concert at Levi’s Stadium (July 2, 2022)
The analysis described in this section is primarily based on the surveys administered after the Grupo Firme concert that took place at Levi’s Stadium on July 2, 2022. Just after the event, an electronic survey was emailed to attendees, resulting in 411 valid responses, representing 1,919 people. The resulting measurement error in the results that follow is 2.6%.[40] The economic impact measurements based on this survey are described in this section. Additionally, there were impacts from the visiting artists, and the 49ers organization.
3.101 Direct and Indirect Spending: Santa Clara County
Attendee Survey
Of the survey respondents, 61 percent were visitors to Santa Clara County who came specifically for the event and their trip did not replace another visit. The average size of the paying party represented in each survey is 3.37 for incremental visitors.[41] The average length of stay for each incremental visitor in the county was 1.57 days. The typical incremental visitor spent $153 per day leading to $241 in spending for the entire trip to Santa Clara County.
Based on these findings from the survey analysis, the total direct expenditures by incremental visitors to Santa Clara County are $2.25 million, as shown in Exhibit 3.10-1 below.
Exhibit 3.10-1
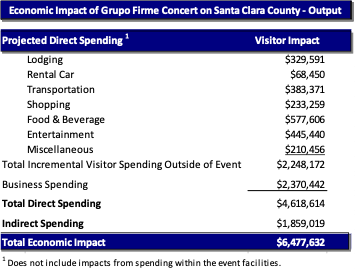
New incremental indirect spending is about $1.9 million. Total economic impact, in terms of output, from incremental visitors is approximately $6.5 million on Santa Clara County because of the July 2, 2022 Grupo Firme concert. All measurements account for incremental visitor spending, not local resident spending that is above and beyond what they would have spent if not for this event taking place.
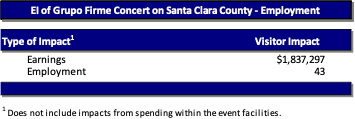
Earnings and Employment
Portions of the initial round of spending from the direct economic impact goes to pay employees and others directly as earnings (see Section 2.2 above for an explanation of the methodology). As shown in Exhibit 3.10-2, incremental earnings of approximately $1.8 million and the equivalent of about 43 FTE jobs are created from the initial spending in the local community.
Exhibit 3.10-2
Fiscal Impact
The new incremental direct tax and fee impact on the city of Santa Clara, city of San José, and Santa Clara County is based on the various tax rates and fees described in Section 2.4. In addition to economic impacts to local businesses, these local governments benefit from the operations of these events in the form of tax revenues and fees. Exhibit 3.10-3 shows the various local taxes and fees relevant for this analysis. Though other fiscal impacts were generated as a result of this spending, only the tax and fee categories detailed below are measured in this report.
Exhibit 3.10-3

Direct taxes and fees on the aforementioned tax categories are about $125,000 to SCSA, $52,000 in the city of Santa Clara, $23,000 in San José, and $22,000 in Santa Clara County because of the concert. Additionally, taxes are collected on the indirect spending that occurs because of the event. These total (across the three jurisdictions) more than $45,000 and are based on the average taxes collected compared with spending that takes place within the three jurisdictions. Overall, the total fiscal impact is nearly $267,000.[42]
3.11 The Red Hot Chili Peppers Concert at Levi’s Stadium (July 29, 2022)
The analysis described in this section is primarily based on the surveys administered after the Red Hot Chili Peppers concert that took place at Levi’s Stadium on July 29, 2022. Just after the event, an electronic survey was emailed to attendees, resulting in 1,124 valid responses, representing 2,701 people. The resulting measurement error in the results that follow is 2.1%.[43] The economic impact measurements based on this survey are described in this section. Additionally, there were impacts from the visiting artists, and the 49ers organization.
3.111 Direct and Indirect Spending: Santa Clara County
Attendee Survey
Of the survey respondents, 61 percent were visitors to Santa Clara County who came specifically for the event and their trip did not replace another visit. The average size of the paying party represented in each survey is 2.48 for incremental visitors.[44] The average length of stay for each incremental visitor in the county was 1.55 days. The typical incremental visitor spent $138 per day leading to $214 in spending for the entire trip to Santa Clara County.
Based on these findings from the survey analysis, the total direct expenditures by incremental visitors to Santa Clara County are $3.8 million, as shown in Exhibit 3.11-1 below.
Exhibit 3.11-1
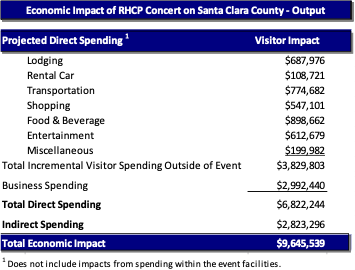
New incremental indirect spending is about $2.8 million. Total economic impact, in terms of output, from incremental visitors is approximately $9.6 million on Santa Clara County because of the July 29, 2022 Red Hot Chili Peppers concert. All measurements account for incremental visitor spending, not local resident spending that is above and beyond what they would have spent if not for this event taking place.
Earnings and Employment
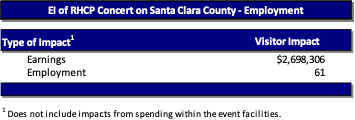
Portions of the initial round of spending from the direct economic impact goes to pay employees and others directly as earnings (see Section 2.2 above for an explanation of the methodology). As shown in Exhibit 3.11-2, incremental earnings of approximately $2.7 million and the equivalent of about 61 FTE jobs are created from the initial spending in the local community.
Exhibit 3.11-2
Fiscal Impact
The new incremental direct tax and fee impact on the city of Santa Clara, city of San José, and Santa Clara County is based on the various tax rates and fees described in Section 2.4. In addition to economic impacts to local businesses, these local governments benefit from the operations of these events in the form of tax revenues and fees. Exhibit 3.11-3 shows the various local taxes and fees relevant for this analysis. Though other fiscal impacts were generated as a result of this spending, only the tax and fee categories detailed below are measured in this report.
Exhibit 3.11-3
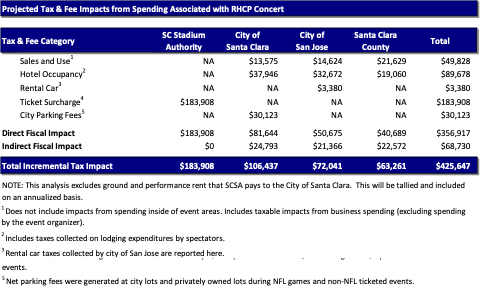
Direct taxes and fees on the aforementioned tax categories are about $184,000 to SCSA, $82,000 in the city of Santa Clara, $51,000 in San José, and $41,000 in Santa Clara County because of the concert. Additionally, taxes are collected on the indirect spending that occurs because of the event. These total (across the three jurisdictions) more than $69,000 and are based on the average taxes collected compared with spending that takes place within the three jurisdictions. Overall, the total fiscal impact is over $426,000.[45]
3.12 The Weeknd Concert at Levi’s Stadium (August 27, 2022)
The analysis described in this section is primarily based on the surveys administered after The Weeknd concert that took place at Levi’s Stadium on August 27, 2022. Just after the event, an electronic survey was emailed to attendees, resulting in 1,043 valid responses, representing 2,424 people. The resulting measurement error in the results that follow is 2.2%.[46] The economic impact measurements based on this survey are described in this section. Additionally, there were impacts from the visiting artists, and the 49ers organization.
3.121 Direct and Indirect Spending: Santa Clara County
Attendee Survey
Of the survey respondents, 57 percent were visitors to Santa Clara County who came specifically for the event and their trip did not replace another visit. The average size of the paying party represented in each survey is 2.44 for incremental visitors.[47] The average length of stay for each incremental visitor in the county was 1.53 days. The typical incremental visitor spent $148 per day leading to $226 in spending for the entire trip to Santa Clara County.
Based on these findings from the survey analysis, the total direct expenditures by incremental visitors to Santa Clara County are $4.3 million, as shown in Exhibit 3.12-1 below.
Exhibit 3.12-1
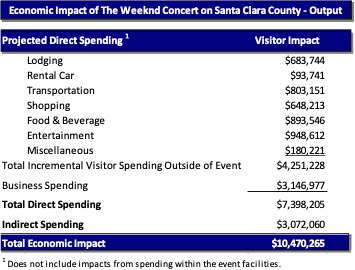
New incremental indirect spending is about $3.1 million. Total economic impact, in terms of output, from incremental visitors is approximately $10.5 million on Santa Clara County because of the August 27, 2022 The Weeknd concert. All measurements account for incremental visitor spending, not local resident spending that is above and beyond what they would have spent if not for this event taking place.
Earnings and Employment
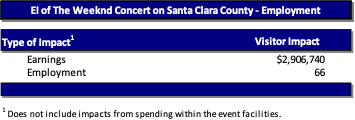
Portions of the initial round of spending from the direct economic impact goes to pay employees and others directly as earnings (see Section 2.2 above for an explanation of the methodology). As shown in Exhibit 3.12-2, incremental earnings of approximately $2.9 million and the equivalent of about 66 FTE jobs are created from the initial spending in the local community.
Exhibit 3.12-2
Fiscal Impact
The new incremental direct tax and fee impact on the city of Santa Clara, city of San José, and Santa Clara County is based on the various tax rates and fees described in Section 2.4. In addition to economic impacts to local businesses, these local governments benefit from the operations of these events in the form of tax revenues and fees. Exhibit 3.12-3 shows the various local taxes and fees relevant for this analysis. Though other fiscal impacts were generated as a result of this spending, only the tax and fee categories detailed below are measured in this report.
Exhibit 3.12-3
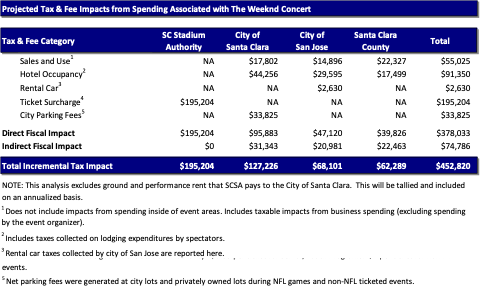
Direct taxes and fees on the aforementioned tax categories are about $195,000 to SCSA, $96,000 in the city of Santa Clara, $47,000 in San José, and $40,000 in Santa Clara County because of the concert. Additionally, taxes are collected on the indirect spending that occurs because of the event. These total (across the three jurisdictions) more than $75,000 and are based on the average taxes collected compared with spending that takes place within the three jurisdictions. Overall, the total fiscal impact is $453,000.[48]
3.13 The Mexico vs. Colombia soccer match at Levi’s Stadium (September 27, 2022)
The analysis described in this section is primarily based on the surveys administered after the Mexico vs. Colombia soccer match that took place at Levi’s Stadium on September 27, 2022. After the event, an electronic survey was emailed to attendees, resulting in 470 valid responses, representing 1,605 people. The resulting measurement error in the results that follow is 2.6%.[49] The economic impact measurements based on this survey are described in this section. Additionally, there were impacts from the visiting artists, and the 49ers organization.
3.131 Direct and Indirect Spending: Santa Clara County
Attendee Survey
Of the survey respondents, 54 percent were visitors to Santa Clara County who came specifically for the event and their trip did not replace another visit. The average size of the paying party represented in each survey is 3.49 for incremental visitors.[50] The average length of stay for each incremental visitor in the county was 1.21 days. The typical incremental visitor spent $84 per day leading to $102 in spending for the entire trip to Santa Clara County.
Based on these findings from the survey analysis, the total direct expenditures by incremental visitors to Santa Clara County are $2.4 million, as shown in Exhibit 3.13-1 below.
Exhibit 3.13-1
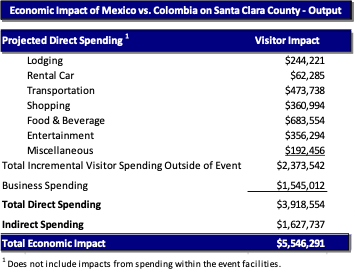
New incremental indirect spending is about $1.6 million. Total economic impact, in terms of output, from incremental visitors is approximately $5.5 million on Santa Clara County because of the September 27, 2022 Mexico vs. Colombia soccer match. All measurements account for incremental visitor spending, not local resident spending that is above and beyond what they would have spent if not for this event taking place.
Earnings and Employment
Portions of the initial round of spending from the direct economic impact goes to pay employees and others directly as earnings (see Section 2.2 above for an explanation of the methodology). As shown in Exhibit 3.13-2, incremental earnings of approximately $1.5 million and the equivalent of about 35 FTE jobs are created from the initial spending in the local community.
Exhibit 3.13-2
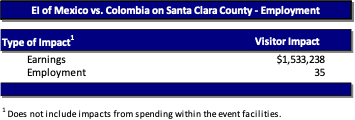
Fiscal Impact
The new incremental direct tax and fee impact on the city of Santa Clara, city of San José, and Santa Clara County is based on the various tax rates and fees described in Section 2.4. In addition to economic impacts to local businesses, these local governments benefit from the operations of these events in the form of tax revenues and fees. Exhibit 3.13-3 shows the various local taxes and fees relevant for this analysis. Though other fiscal impacts were generated as a result of this spending, only the tax and fee categories detailed below are measured in this report.
Exhibit 3.13-3

Direct taxes and fees on the aforementioned tax categories are about $256,000 to SCSA, $62,000 in the city of Santa Clara, $25,000 in San José, and $16,000 in Santa Clara County because of the event. Additionally, taxes are collected on the indirect spending that occurs because of the event. These total (across the three jurisdictions) almost $40,000 and are based on the average taxes collected compared with spending that takes place within the three jurisdictions. Overall, the total fiscal impact is nearly $398,000.[51]
3.14 The Elton John Concert at Levi’s Stadium (October 8, 2022)
The analysis described in this section is primarily based on the surveys administered after the Elton John concert that took place at Levi’s Stadium on October 8, 2022. After the event, an electronic survey was emailed to attendees, resulting in 1,965 valid responses, representing 4,612 people. The resulting measurement error in the results that follow is 1.8%.[52] The economic impact measurements based on this survey are described in this section. Additionally, there were impacts from the visiting artists, and the 49ers organization.
3.141 Direct and Indirect Spending: Santa Clara County
Attendee Survey
Of the survey respondents, 64 percent were visitors to Santa Clara County who came specifically for the event and their trip did not replace another visit. The average size of the paying party represented in each survey is 2.35 for incremental visitors.[53] The average length of stay for each incremental visitor in the county was 1.50 days. The typical incremental visitor spent $154 per day leading to $230 in spending for the entire trip to Santa Clara County.
Based on these findings from the survey analysis, the total direct expenditures by incremental visitors to Santa Clara County are $4.1 million, as shown in Exhibit 3.14-1 below.
Exhibit 3.14-1
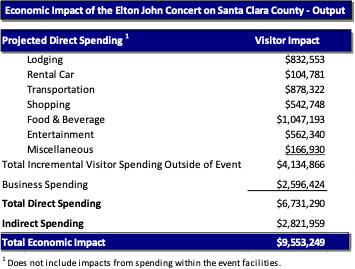
New incremental indirect spending is about $2.8 million. Total economic impact, in terms of output, from incremental visitors is approximately $9.5 million on Santa Clara County because of the October 8, 2022 Elton John concert. All measurements account for incremental visitor spending, not local resident spending that is above and beyond what they would have spent if not for this event taking place.
Earnings and Employment
Portions of the initial round of spending from the direct economic impact goes to pay employees and others directly as earnings (see Section 2.2 above for an explanation of the methodology). As shown in Exhibit 3.14-2, incremental earnings of approximately $2.6 million and the equivalent of about 58 FTE jobs are created from the initial spending in the local community.
Exhibit 3.14-2

Fiscal Impact
The new incremental direct tax and fee impact on the city of Santa Clara, city of San José, and Santa Clara County is based on the various tax rates and fees described in Section 2.4. In addition to economic impacts to local businesses, these local governments benefit from the operations of these events in the form of tax revenues and fees. Exhibit 3.14-3 shows the various local taxes and fees relevant for this analysis. Though other fiscal impacts were generated as a result of this spending, only the tax and fee categories detailed below are measured in this report.
Exhibit 3.14-3
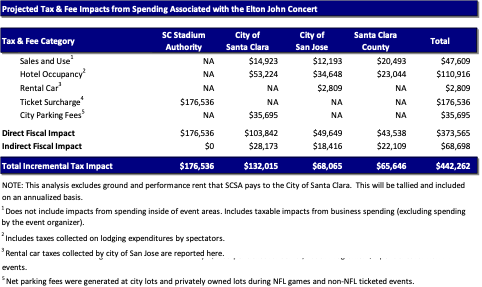
Direct taxes and fees on the aforementioned tax categories are about $177,000 to SCSA, $104,000 in the city of Santa Clara, $50,000 in San José, and $44,000 in Santa Clara County because of the concert. Additionally, taxes are collected on the indirect spending that occurs because of the event. These total (across the three jurisdictions) more than $69,000 and are based on the average taxes collected compared with spending that takes place within the three jurisdictions. Overall, the total fiscal impact is over $442,000.[54]
3.15 Kansas City Chiefs at San Francisco 49ers at Levi’s Stadium (October 23, 2022)
The analysis described in this section is primarily based on the surveys administered after the NFL game that took place at Levi’s Stadium on October 23, 2022. After the event, an electronic survey was emailed to attendees, resulting in 714 valid responses, representing 1,697 people. The resulting measurement error in the results that follow is 2.4%.[55] The economic impact measurements based on this survey are described in this section. Additionally, there were impacts from the visiting artists, and the 49ers organization.
3.151 Direct and Indirect Spending: Santa Clara County
Attendee Survey
Of the survey respondents, 63 percent were visitors to Santa Clara County who came specifically for the event and their trip did not replace another visit. The average size of the paying party represented in each survey is 2.40 for incremental visitors.[56] The average length of stay for each incremental visitor in the county was 1.64 days. The typical incremental visitor spent $175 per day leading to $288 in spending for the entire trip to Santa Clara County.
Based on these findings from the survey analysis, the total direct expenditures by incremental visitors to Santa Clara County are $10.0 million, as shown in Exhibit 3.15-1 below.
Exhibit 3.15-1
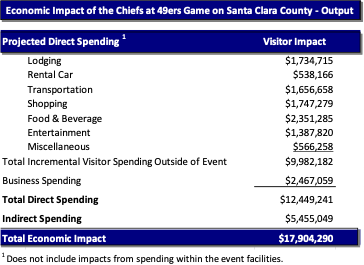
New incremental indirect spending is about $5.5 million. Total economic impact, in terms of output, from incremental visitors and business spending is approximately $17.9 million on Santa Clara County because of the October 23, 2022 NFL game. All measurements account for incremental visitor spending, not local resident spending that is above and beyond what they would have spent if not for this event taking place.
Earnings and Employment
Portions of the initial round of spending from the direct economic impact goes to pay employees and others directly as earnings (see Section 2.2 above for an explanation of the methodology). As shown in Exhibit 3.15-2, incremental earnings of approximately $4.8 million and the equivalent of about 99 FTE jobs are created from the initial spending in the local community.
Exhibit 3.15-2
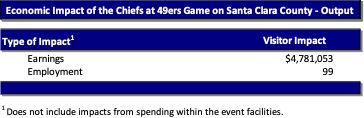
Fiscal Impact
The new incremental direct tax and fee impact on the city of Santa Clara, city of San José, and Santa Clara County is based on the various tax rates and fees described in Section 2.4. In addition to economic impacts to local businesses, these local governments benefit from the operations of these events in the form of tax revenues and fees. Exhibit 3.15-3 shows the various local taxes and fees relevant for this analysis. Though other fiscal impacts were generated as a result of this spending, only the tax and fee categories detailed below are measured in this report.
Exhibit 3.15-3
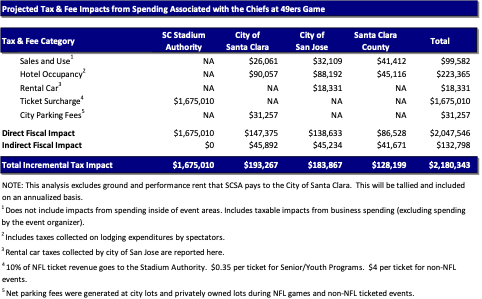
Direct taxes and fees on the aforementioned tax categories are about $1.68 million to SCSA, $147,000 in the city of Santa Clara, $139,000 in San José, and $87,000 in Santa Clara County because of the NFL game. Additionally, taxes are collected on the indirect spending that occurs because of the event. These total (across the three jurisdictions) more than $132,000 and are based on the average taxes collected compared with spending that takes place within the three jurisdictions. Overall, the total fiscal impact is over $2.18 million.[57]
3.16 Miami Dolphins at San Francisco 49ers at Levi’s Stadium (December 4, 2022)
The analysis described in this section is primarily based on the surveys administered after the NFL game that took place at Levi’s Stadium on December 4, 2022. After the event, an electronic survey was emailed to attendees, resulting in 852 valid responses, representing 2,064 people. The resulting measurement error in the results that follow is 2.2%.[58] The economic impact measurements based on this survey are described in this section. Additionally, there were impacts from the visiting artists, and the 49ers organization.
3.161 Direct and Indirect Spending: Santa Clara County
Attendee Survey
Of the survey respondents, 71 percent were visitors to Santa Clara County who came specifically for the event and their trip did not replace another visit. The average size of the paying party represented in each survey is 2.53 for incremental visitors.[59] The average length of stay for each incremental visitor in the county was 1.99 days. The typical incremental visitor spent $126 per day leading to $251 in spending for the entire trip to Santa Clara County.
Based on these findings from the survey analysis, the total direct expenditures by incremental visitors to Santa Clara County are $8.0 million, as shown in Exhibit 3.16-1 below.
Exhibit 3.16-1
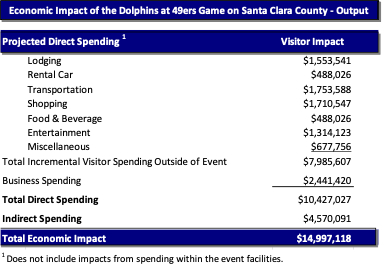
New incremental indirect spending is about $4.6 million. Total economic impact, in terms of output, from incremental visitors and business spending is approximately $15.0 million on Santa Clara County because of the December 4, 2022 NFL game. All measurements account for incremental visitor spending, not local resident spending that is above and beyond what they would have spent if not for this event taking place.
Earnings and Employment
Portions of the initial round of spending from the direct economic impact goes to pay employees and others directly as earnings (see Section 2.2 above for an explanation of the methodology). As shown in Exhibit 3.16-2, incremental earnings of approximately $4.1 million and the equivalent of about 82 FTE jobs are created from the initial spending in the local community.
Exhibit 3.16-2
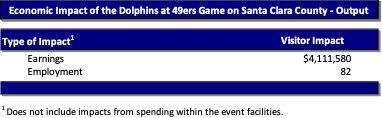
Fiscal Impact
The new incremental direct tax and fee impact on the city of Santa Clara, city of San José, and Santa Clara County is based on the various tax rates and fees described in Section 2.4. In addition to economic impacts to local businesses, these local governments benefit from the operations of these events in the form of tax revenues and fees. Exhibit 3.16-3 shows the various local taxes and fees relevant for this analysis. Though other fiscal impacts were generated as a result of this spending, only the tax and fee categories detailed below are measured in this report.
Exhibit 3.16-3
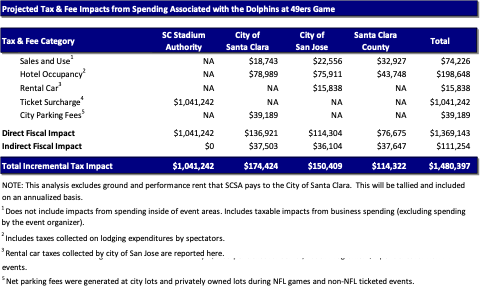
Direct taxes and fees on the aforementioned tax categories are about $1.04 million to SCSA, $137,000 in the city of Santa Clara, $114,000 in San José, and $77,000 in Santa Clara County because of the NFL game. Additionally, taxes are collected on the indirect spending that occurs because of the event. These total (across the three jurisdictions) more than $111,000 and are based on the average taxes collected compared with spending that takes place within the three jurisdictions. Overall, the total fiscal impact is over $1.48 million.[60]
3.17 Los Angeles Football Club at San Jose Earthquakes at Levi’s Stadium (May 6, 2023)
The analysis described in this section is primarily based on the surveys administered after the LAFC at SJ Earthquakes soccer match that took place at Levi’s Stadium on May 6, 2023. After the event, an electronic survey was emailed to attendees, resulting in 420 valid responses, representing 1,210 people. The resulting measurement error in the results that follow is 2.1%.[61] The economic impact measurements based on this survey are described in this section. Additionally, there were impacts from the visiting artists, and the 49ers organization.
3.171 Direct and Indirect Spending: Santa Clara County
Attendee Survey
Of the survey respondents, 39 percent were visitors to Santa Clara County who came specifically for the event and their trip did not replace another visit. The average size of the paying party represented in each survey is 3.12 for incremental visitors.[62] The average length of stay for each incremental visitor in the county was 1.1 days. The typical incremental visitor spent $55 per day leading to $61 in spending for the entire trip to Santa Clara County.
Based on these findings from the survey analysis, the total direct expenditures by incremental visitors to Santa Clara County are $1.8 million, as shown in Exhibit 3.17-1 below.
Exhibit 3.17-1
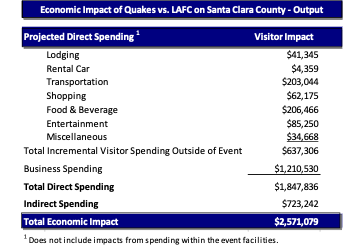
New incremental indirect spending is about $723,000. Total economic impact, in terms of output, from incremental visitors is approximately $2.6 million on Santa Clara County because of the May 6, 2023 Earthquakes vs. LAFC soccer match. All measurements account for incremental visitor spending, not local resident spending that is above and beyond what they would have spent if not for this event taking place.
Earnings and Employment
Portions of the initial round of spending from the direct economic impact goes to pay employees and others directly as earnings (see Section 2.2 above for an explanation of the methodology). As shown in Exhibit 3.17-2, incremental earnings of approximately $748,000 and the equivalent of about 18 FTE jobs are created from the initial spending in the local community.
Exhibit 3.17-2
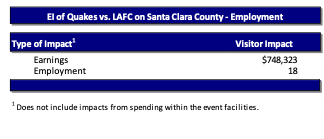
Fiscal Impact
The new incremental direct tax and fee impact on the city of Santa Clara, city of San José, and Santa Clara County is based on the various tax rates and fees described in Section 2.4. In addition to economic impacts to local businesses, these local governments benefit from the operations of these events in the form of tax revenues and fees. Exhibit 3.17-3 shows the various local taxes and fees relevant for this analysis. Though other fiscal impacts were generated as a result of this spending, only the tax and fee categories detailed below are measured in this report.
Exhibit 3.17-3

Direct taxes and fees on the aforementioned tax categories are about $172,000 to SCSA, $36,000 in the city of Santa Clara, $5,800 in San José, and $8,000 in Santa Clara County because of the event. Additionally, taxes are collected on the indirect spending that occurs because of the event, which (across the three jurisdictions) totals nearly $18,000.[63] Overall, the total fiscal impact is nearly $239,000.[64]
3.18 The 2023 CONCACAF Gold Cup at Levi’s Stadium (July 2, 2023)
The analysis described in this section is primarily based on the surveys administered after the 2023 Concacaf Gold Cup that took place at Levi’s Stadium on July 2, 2023. After the event, an electronic survey was emailed to attendees, resulting in 488 valid responses, representing 2,422 people. The resulting measurement error in the results that follow is 1.9%.[65] The economic impact measurements based on this survey are described in this section. Additionally, there were impacts from the visiting artists, and the 49ers organization.
3.181 Direct and Indirect Spending: Santa Clara County
Attendee Survey
Of the survey respondents, 61 percent were visitors to Santa Clara County who came specifically for the event and their trip did not replace another visit. The average size of the paying party represented in each survey is 3.61 for incremental visitors.[66] The average length of stay for each incremental visitor in the county was 1.18 days. The typical incremental visitor spent $89 per day leading to $105 in spending for the entire trip to Santa Clara County.
Based on these findings from the survey analysis, the total direct expenditures by incremental visitors to Santa Clara County are $3.5 million, as shown in Exhibit 3.18-1 below.
Exhibit 3.18-1
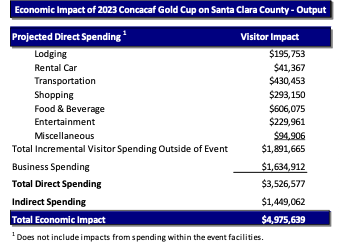
New incremental indirect spending is over $1.4 million. Total economic impact, in terms of output, from incremental visitors is approximately $5.0 million on Santa Clara County because of the 2023 Concacaf Gold Cup. All measurements account for incremental visitor spending, not local resident spending that is above and beyond what they would have spent if not for this event taking place.
Earnings and Employment
Portions of the initial round of spending from the direct economic impact goes to pay employees and others directly as earnings (see Section 2.2 above for an explanation of the methodology). As shown in Exhibit 3.18-2, incremental earnings of approximately $1.4 million and the equivalent of about 32 FTE jobs are created from the initial spending in the local community.
Exhibit 3.18-2
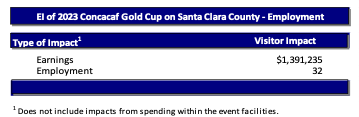
Fiscal Impact
The new incremental direct tax and fee impact on the city of Santa Clara, city of San José, and Santa Clara County is based on the various tax rates and fees described in Section 2.4. In addition to economic impacts to local businesses, these local governments benefit from the operations of these events in the form of tax revenues and fees. Exhibit 3.18-3 shows the various local taxes and fees relevant for this analysis. Though other fiscal impacts were generated as a result of this spending, only the tax and fee categories detailed below are measured in this report.
Exhibit 3.18-3

Direct taxes and fees on the aforementioned tax categories are about $250,000 to SCSA, $49,000 in the city of Santa Clara, $18,000 in San José, and $16,000 in Santa Clara County because of the event. Additionally, taxes are collected on the indirect spending that occurs because of the event, which (across the three jurisdictions) totals nearly $35,000.[67] Overall, the total fiscal impact is nearly $368,000.[68]
3.19 Taylor Swift Concerts at Levi’s Stadium (July 28 & 29, 2023)
The analysis described in this section is primarily based on the surveys administered after the Taylor Swift concerts that took place at Levi’s Stadium on July 28 & 29, 2023. After both events, an electronic survey was emailed to attendees, resulting in 3,881 valid responses, representing 9,269 people. The resulting measurement error in the results that follow is 1.4%.[69] The economic impact measurements based on this survey are described in this section. Additionally, there were impacts from the visiting artists, and the 49ers organization.
3.191 Direct and Indirect Spending: Santa Clara County
Attendee Survey
Of the survey respondents, 70 percent were visitors to Santa Clara County who came specifically for the event and their trip did not replace another visit. The average size of the paying party represented in each survey is 2.43 for incremental visitors.[70] The average length of stay for each incremental visitor in the county was 1.82 days. The typical incremental visitor spent $182 per day leading to $332 in spending for the entire trip to Santa Clara County.
Based on these findings from the survey analysis, the total direct expenditures by incremental visitors to Santa Clara County are $19.2 million, as shown in Exhibit 3.19-1 below.
Exhibit 3.19-1
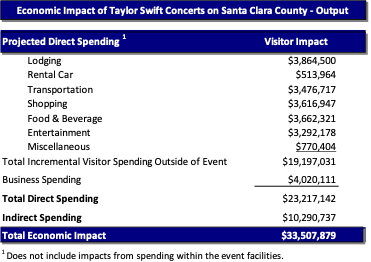
New incremental indirect spending is about $10.3 million. Total economic impact, in terms of output, is approximately $33.5 million on Santa Clara County because of the July 28 & 29, 2023 Taylor Swift concerts. All measurements account for incremental visitor spending, not local resident spending that is above and beyond what they would have spent if not for this event taking place.
Earnings and Employment
Portions of the initial round of spending from the direct economic impact goes to pay employees and others directly as earnings (see Section 2.2 above for an explanation of the methodology). As shown in Exhibit 3.19-2, incremental earnings of approximately $8.9 million and the equivalent of about 182 FTE jobs are created from the initial spending in the local community.
Exhibit 3.19-2
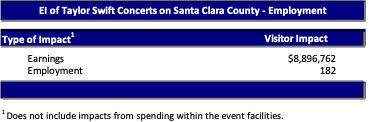
Fiscal Impact
The new incremental direct tax and fee impact on the city of Santa Clara, city of San José, and Santa Clara County is based on the various tax rates and fees described in Section 2.4. In addition to economic impacts to local businesses, these local governments benefit from the operations of these events in the form of tax revenues and fees. Exhibit 3.19-3 shows the various local taxes and fees relevant for this analysis. Though other fiscal impacts were generated as a result of this spending, only the tax and fee categories detailed below are measured in this report.
Exhibit 3.19-3
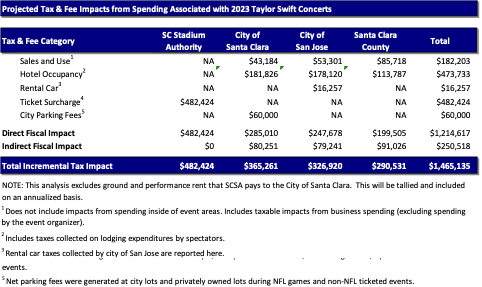
Direct taxes and fees on the aforementioned tax categories are about $482,000 to SCSA, $285,000 in the city of Santa Clara, $248,000 in San José, and $200,000 in Santa Clara County because of the concert. Additionally, taxes are collected on the indirect spending that occurs because of the event. These total (across the three jurisdictions) more than $250,000 and are based on the average taxes collected compared with spending that takes place within the three jurisdictions. Overall, the total fiscal impact is over $1.47 million.[71]
4.0 Economic Impact of Levi’s Stadium 2023-24 Through July 2023 and since Opening
Levi’s Stadium opened in the summer of 2014. Since then, it has hosted many large-scale events such as professional and intercollegiate football games, soccer matches, concerts, and action sports events, as well as over one thousand smaller events drawing hundreds or thousands of patrons for corporate and celebratory reasons. Each of these events has generated local economic impact on the surrounding community. This Section 4.0 provides an analysis of the economic impact of Levi’s Stadium during 2023-24 (but up through July 2023), and then an estimate of the total impact since the venue opened.[72]
4.1 Economic Impact of Levi’s Stadium during 2023-24 Through July 2023
As shown in Exhibit 4.1-1 below, the economic impact on Santa Clara County (inclusive of the cities of Santa Clara and San José) is estimated to be over $33 million in direct spending from incremental visitors and an additional $11 million in spending by visiting teams, event owners, media, sponsors, vendors, the 49ers organization (and stadium and management organizations). After accounting for the indirect spending, the total economic impact is over $46 million through July 2023. However, this analysis does not yet include the upcoming 49ers season as well as additional concerts and other events. It is limited to the period April-July 2023 (as part of the 2023-24 fiscal year).
Exhibit 4.1-1
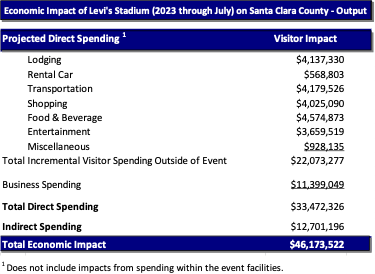
A portion of this incremental impact has led to earnings by local residents, as shown in Exhibit 4.1-2 at more than $11 million as well as the equivalent of nearly 237 FTE jobs.
Exhibit 4.1-2
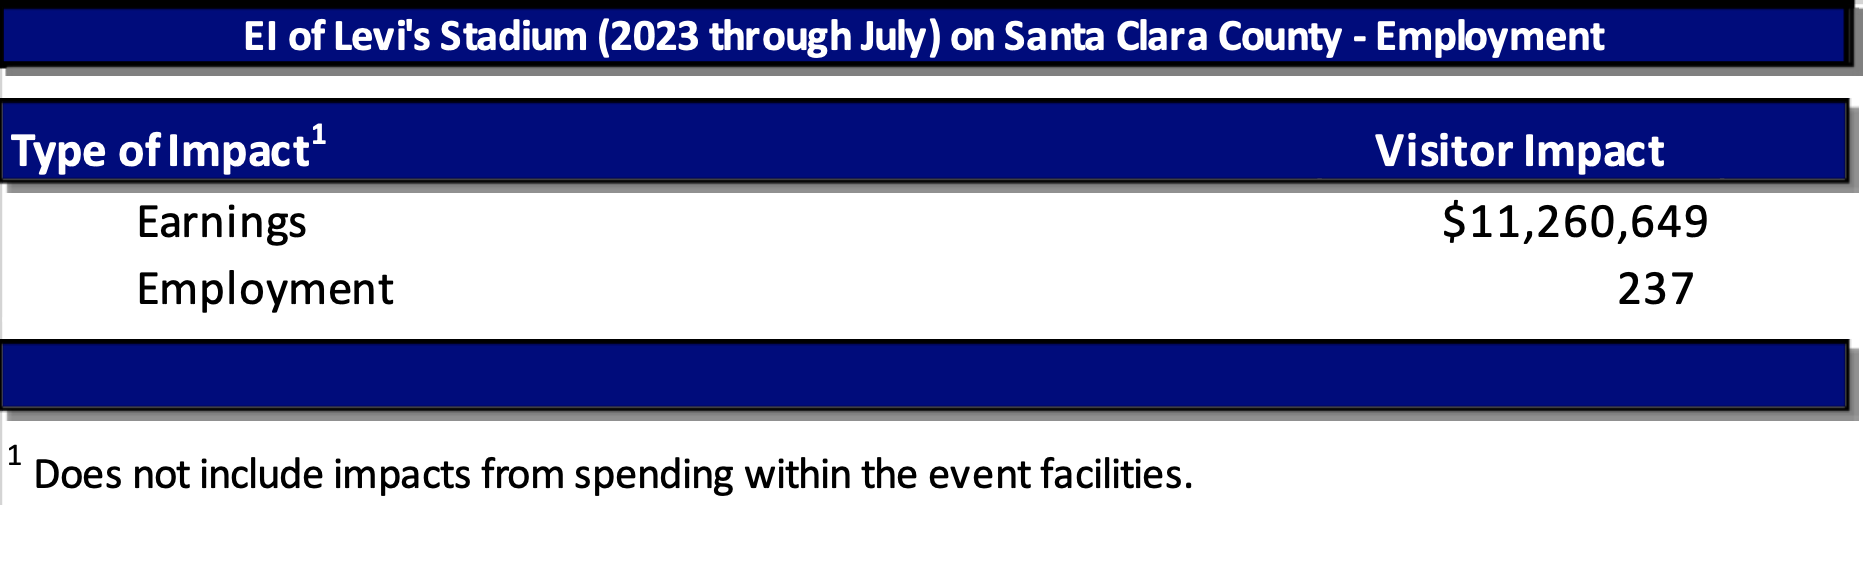
The impact of Levi’s Stadium in 2023-24 (through July 2023) on local governments and their agencies is shown below in Exhibit 4.1-3. As can be seen, SCSA has received nearly $12 million in ticket surcharges and rent that would not have occurred had Levi’s Stadium not been built. The city of Santa Clara has received more than $975,000 from sales and hotel taxes, city parking fees, rent, and additional taxes. Additionally, San José and Santa Clara County have received combined $9.7 million driven by property and possessory interest taxes, sales, hotel, and rental car taxes. The total fiscal impact is $22.6 million through July 2023 (and expected to be approximately $55 million in 2023-24 once the fiscal year ends in March 2024).
Exhibit 4.1-3
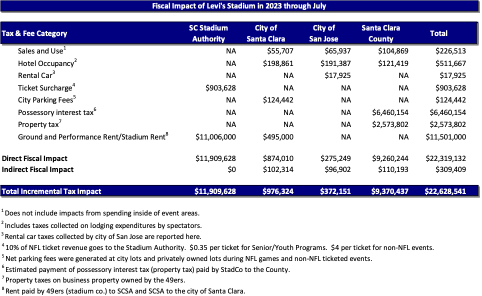
4.2 Economic Impact of Levi’s Stadium since Opening in Summer 2014
During 2014-15 through July 2023, Levi’s Stadium has welcomed over 8.7 million people to visit for approximately 155 major events (including Super Bowl 50) and nearly one thousand special/corporate events.[73] These events have provided substantial impacts to the local community and government agencies. As shown in Exhibit 4.2-1, total incremental spending is over $1.0 billion by visiting patrons who came to town because of the events. Combined with commensurate spending by visiting teams/artists/athletes, sponsors, media, event owners, vendors, the San Francisco 49ers, and the stadium company, and the re-spending of those dollars via the multiplier effect, total economic impact since opening for Levi’s Stadium is just over $2.0 billion.
Exhibit 4.2-1
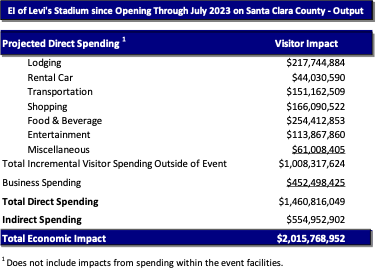
Exhibit 4.2-2
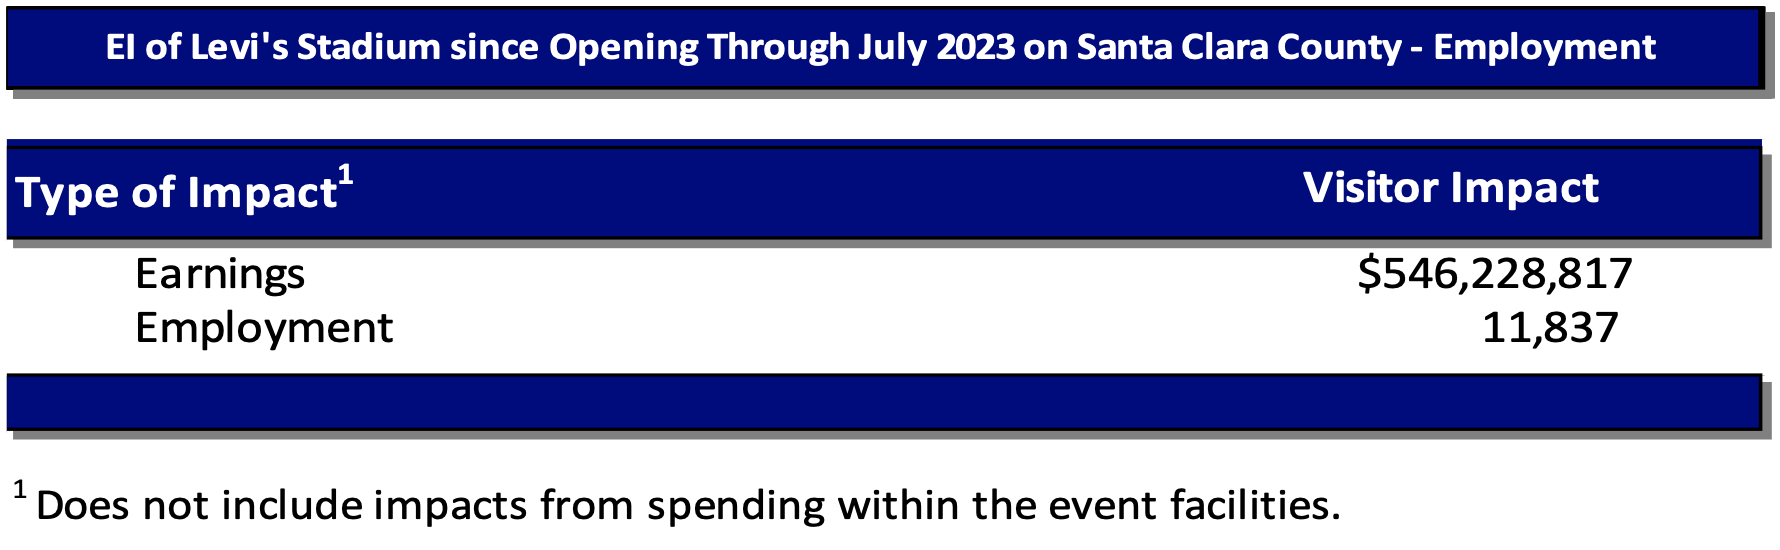
The economic impact on local governments (fiscal impact) since the opening of Levi’s Stadium in mid-2014 is shown in Exhibit 4.2-3. Nearly $311 million has been generated for SCSA, more than $35 million for the city of Santa Clara, and over $122 million for San José and Santa Clara County combined. Much of the impact is from sales and hotel taxes, ticket surcharges and parking fees, possessory interest taxes (and property taxes), and rent from the 49ers stadium company. In total, local governments and SCSA have received nearly $469 million in net new fiscal impact.
Exhibit 4.2-3
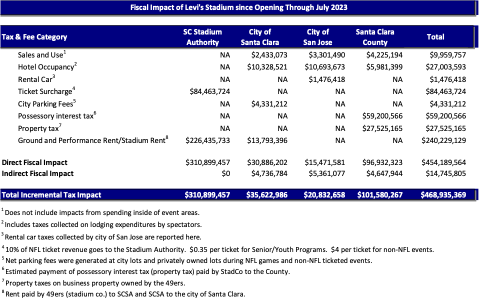
5.0 Limitations of the Study
5.1 Limitations that make the Estimate an Underestimate of True Economic Impact
Complete expenditures by the media companies covering the events are not accounted for in this Report. Also, any business expenditures (e.g., sponsorship activation) above what were reported are not counted in the measurement of economic impact, thus making this estimate a lower-bound of the true impact.
As described in Section 2.0, it is properly conservative to count spending by local residents and by “casual” visitors and “time-switchers” as not counting towards economic impact because it is assumed that their spending would have occurred even without the event having taken place. Where possible, estimates of incremental spending by these parties were generated, but are not stated in the economic impact figures.
Only fiscal impacts related to the tax categories detailed in Section 2.4 are calculated in this Report. There are other types of taxes and fees that are not included in this measurement of tax revenues generated by the city, county, and state.
One shortcoming of standard economic impact analysis is that most measurements only account for the current new spending because of an event, team, etc., but ignore the possibility that an event might cause an increase in the number of future visitors to the community.[74] The impacts of any future visits that are caused by having attended are not part of the measurement in this Report. Another way in which this occurs is through the media coverage of an event and a viewer deciding to vacation in the Santa Clara area because of that.
Communities which support sporting and cultural events are believed to derive significant benefit from the national and international focus and media attention created by such events. During televised events, for instance, the announcers mention the name of the city, often increasing awareness about it. Additionally, television viewers saw many images of people enjoying themselves in city, creating an enhanced image of the area. The city is exposed to millions of people through appearances in many media forums such as newspapers, radio, and the Internet. The benefits derived are similar to those of companies who advertise their company name as opposed to a specific product. The advertising or media attention creates “awareness” and “goodwill” toward that company, or in this case, the city. Increased awareness is translated into economic benefits in subtle, but meaningful ways. It is extremely difficult to measure the translation of media coverage into actual new visitor expenditures. This media impact is not part of the economic impact measured in Section 3.0.
One role of government is to aid in the provision of cultural, civic, and entertainment goods and services that residents enjoy, but that no private firm is willing to provide because the goods or services are “public goods”.[75] Major sports and cultural events add to the quality of life in a region in a manner similar to that of zoos, museums, aquariums, parks, arts institutions, and other public goods, but in significantly different ways. Cultural events of all types provide an entertainment option for some, especially those who value attending or viewing the events. Moreover, many of these events may be perceived by local residents as helping to portray Santa Clara as a cosmopolitan, ‘major-league’ city.
Psychic Impact
Psychic impact is the emotional impact that is generated by hosting significant regional, national or international events. Cultural events often are part of the fabric of a community. They add to civic pride and increase community spirit. Emotional benefits that are received by members of a community who are not directly involved with managing an event, but who still strongly identify with the event, are part of the overall psychic impact. Sports or other cultural events are often a common connection that provides entertainment and conversation at the office or in the neighborhood, for instance. Most other industries do not provide the same degree of emotional impact.
As an example, when Atlanta was awarded the 1996 Summer Olympics, locals were moved by the announcement. Many people cried with joy. They felt that Atlanta had now proved itself as a “real” international city. Newspaper reports described the city as a sea of honking horns and cheers as people were swept up with jubilation. If it were possible to quantify in financial terms the collective emotional upswing of Atlantans, what would it have been? The new psychic impact techniques focus on measuring this value. Proper decision-making on how the public should invest its tax dollars requires knowledge of economic impact plus psychic and image impact.
Another example comes from Minnesota where the former governor, Arne Carlson, feels that “If you were to make a list of 10 or 15 of the most prized possessions of the state, [the Twins] would probably be one of them, and you never want to lose one of your prized possessions. Never.”
Event owners are able to capture part of the value of psychic impact through ticket sales, merchandise sales, etc. However, much of the impact, as discussed above, is provided free to the residents through sheer knowledge of the event. This is one of the reasons for the public-private partnerships that build sports venues.
A few estimates of the psychic impact of sports teams have been generated. For instance, the Pittsburgh Penguins of the NHL are worth approximately $16 million per year to the residents of Pittsburgh solely in terms of emotional impact. This works out to an average of about $7.27 per person in the Pittsburgh MSA. The Indiana Pacers have an annual psychic impact on the Indianapolis community of about $35 million per year. The Minnesota Vikings are worth approximately $10 per resident of the state. There are not any current measures of psychic impact of cultural events such as the ones examined in this Report. Estimates of psychic impact are not included in this Report.
The field of economic impact analysis is ripe for the inclusion of psychic impact measurement. There are methods, such as Contingent Valuation Method, that can help quantify these important aspects of sports and cultural events.
5.2 Limitations that make the Estimate an Overestimate of True Economic Impact
This analysis does not account for “reverse time-switchers”, those local residents who leave town during the event period because of the event. To the extent that there are any “reverse time-switchers”, the expenditures that would have been spent by them in town are now spent outside of the local area. There is not any anecdotal evidence that leads the authors to believe that there is any significant loss in local spending due to “reverse time-switchers”.
Opportunity Costs
Economic impact analysis often neglects to account for important opportunity costs. For instance, if the city of Santa Clara had to turn down a major event (that would have generated its own economic impact) because of a time conflict with any of the events measured in this Report, then the total net new incremental gain from hosting the event should account for the lost economic impact that would have occurred had the other event been hosted. The authors are unaware of any such situation in this particular case.
Other potentially important opportunity costs are the impacts from visitors who would have come to town under normal circumstances, but were unable to because the event filled all of the hotels to capacity. If these would-be visitors came anyway and stayed outside of town, then it isn’t a loss in revenue. However, if there were people who did not come to the city of Santa Clara because of an event hosted within the city, then any economic impact from the event being measured should take that loss into account. The authors are unaware of any hotel capacity constraints caused by any event hosted in the city.
Finally, all of the event attendance figures and operational and corporate expenditures were provided by the event organizers. Where possible, attempts were made to discount for non-unique visitors. The Research Team is not responsible for auditing these figures. However, guidelines were provided and discussions with event organizers took place to ensure that they were aware of issues which may cause them to overstate these figures.
5.3 Other Limiting Conditions
Information, estimates and opinions furnished to us and contained in the Report were obtained from sources considered reliable and believed to be true and correct. However, no representation, liability or warranty for the accuracy of such items is assumed by or imposed on us, and is subject to corrections, errors, omissions and withdrawals without notice. Information from all sources not generated by the Research Team was taken without verification or audit. Our analyses are based on estimates and assumptions provided by various governmental authorities, event organizers, and surveys developed in connection with this engagement.
The analyses were based on the work plan described in our contract, estimates and assumptions provided by the event organizers, estimates and assumptions from previous studies, information developed from primary and supplemental research, knowledge of the industry and other sources, including certain information that the event organizers provided. These sources of information and bases of significant estimates and assumptions are stated in the Report.
[1] The degree to which spending inside of a facility is considered economic impact depends on the tax policy regarding the facility and who is the recipient of the spending (i.e., local business or an out-of-area business).
[2] Additionally, having local major sporting events enhances community and civic pride. This is known as psychic impact and is discussed in Section 5.0.
[3] “The Importance of Import Substitution in Marathon Economic Impact Analysis” in the International Journal of Sport Finance, Vol. 2, No. 2, 2007.
[4] “Tracking the Dollars: How Economic Impact Studies can Actually Benefit Managerial Decision Making” with Michael M. Goldman in Sport & Entertainment Review, No. 1, 2015.
[5] The practical measurement of time-switchers is particularly difficult because the survey respondent is being asked about a hypothetical situation, i.e., does this visit replace some other visit during some other time period. In previous studies, the proportion of visitors deemed time-switchers has typically been less than 10 percent. In order to be conservative, this study assumes that 10 percent of visitors are time-switchers, who’s spending should not count toward economic impact.
[6] An employment impact of 100 means that the equivalency of 100 people are working full-time for one year. Thus, if 100 people work full-time for two years, then the employment impact would be 200.
[7] Once estimates of direct spending are calculated, these estimates are entered into IMPLAN to obtain the total economic impact estimates. IMPLAN is a statistical software package that helps to calculate the total economic impact of various phenomena. The detailed matrix of multipliers embedded in the IMPLAN software help to calculate the various spin-off impacts that originate from the initial direct injection of non-local money into a given region. Specifically, IMPLAN generates the following gross economic impact estimates: the short-term impact upon local spending and the long-term impact upon value-added. This long-term impact is comprised of additional local income; additional business taxes; and additional property-type income.
[8] To be clear, the multiplier effect leads to the calculation of the indirect and induced impacts.
[9] Hotel Spending is used as an example for how indirect and induced impacts are generated from the direct spending. A similar flow of spending could be mapped for any of the other initial direct spending categories (e.g., restaurant or retail).
[10] To reiterate, only fiscal impacts to the city of Santa Clara, San José, and Santa Clara County are measured in this report. Fiscal impacts to the state and other counties/cities are generated by these events and operations, but are not detailed in this report.
[11] The analysis assumes that half of the hotel stays are within the SCTID district.
[12] The measurement error is defined at the 95 percent confidence level and assumes random sampling.
[13] Each respondent was asked about how many people he/she was answering the survey on behalf of. In other words, if the respondent was traveling with her spouse and two children and answered spending questions on their behalf, the party size is 4.
[14] These fiscal impacts do not include any allocated fiscal impacts such as property taxes, facility rental, etc. These are analyzed in Section 4.0.
[15] The measurement error is defined at the 95 percent confidence level and assumes random sampling.
[16] Each respondent was asked about how many people he/she was answering the survey on behalf of. In other words, if the respondent was traveling with her spouse and two children and answered spending questions on their behalf, the party size is 4.
[17] These fiscal impacts do not include any allocated fiscal impacts such as property taxes, facility rental, etc. These are analyzed in Section 4.0.
[18] The measurement error is defined at the 95 percent confidence level and assumes random sampling.
[19] Each respondent was asked about how many people he/she was answering the survey on behalf of. In other words, if the respondent was traveling with her spouse and two children and answered spending questions on their behalf, the party size is 4.
[20] These fiscal impacts do not include any allocated fiscal impacts such as property taxes, facility rental, etc. These are analyzed in Section 4.0.
[21] The measurement error is defined at the 95 percent confidence level and assumes random sampling.
[22] Each respondent was asked about how many people he/she was answering the survey on behalf of. In other words, if the respondent was traveling with her spouse and two children and answered spending questions on their behalf, the party size is 4.
[23] These fiscal impacts do not include any allocated fiscal impacts such as property taxes, facility rental, etc. These are analyzed in Section 4.0.
[24] The measurement error is defined at the 95 percent confidence level and assumes random sampling.
[25] Each respondent was asked about how many people he/she was answering the survey on behalf of. In other words, if the respondent was traveling with her spouse and two children and answered spending questions on their behalf, the party size is 4.
[26] These fiscal impacts do not include any allocated fiscal impacts such as property taxes, facility rental, etc. These are analyzed in Section 4.0.
[27] The measurement error is defined at the 95 percent confidence level and assumes random sampling.
[28] Each respondent was asked about how many people he/she was answering the survey on behalf of. In other words, if the respondent was traveling with her spouse and two children and answered spending questions on their behalf, the party size is 4.
[29] These fiscal impacts do not include any allocated fiscal impacts such as property taxes, facility rental, etc. These are analyzed in Section 4.0.
[30] The measurement error is defined at the 95 percent confidence level and assumes random sampling.
[31] Each respondent was asked about how many people he/she was answering the survey on behalf of. In other words, if the respondent was traveling with her spouse and two children and answered spending questions on their behalf, the party size is 4.
[32] These fiscal impacts do not include any allocated fiscal impacts such as property taxes, facility rental, etc. These are analyzed in Section 4.0.
[33] The measurement error is defined at the 95 percent confidence level and assumes random sampling.
[34] Each respondent was asked about how many people he/she was answering the survey on behalf of. In other words, if the respondent was traveling with her spouse and two children and answered spending questions on their behalf, the party size is 4.
[35] There are no payments to SCSA for this game because it is not a regular season NFL game or a non-NFL event.
[36] These fiscal impacts do not include any allocated fiscal impacts such as property taxes, facility rental, etc. These are analyzed in Section 4.0.
[37] The measurement error is defined at the 95 percent confidence level and assumes random sampling.
[38] Each respondent was asked about how many people he/she was answering the survey on behalf of. In other words, if the respondent was traveling with her spouse and two children and answered spending questions on their behalf, the party size is 4.
[39] These fiscal impacts do not include any allocated fiscal impacts such as property taxes, facility rental, etc. These are analyzed in Section 4.0.
[40] The measurement error is defined at the 95 percent confidence level and assumes random sampling.
[41] Each respondent was asked about how many people he/she was answering the survey on behalf of. In other words, if the respondent was traveling with her spouse and two children and answered spending questions on their behalf, the party size is 4.
[42] These fiscal impacts do not include any allocated fiscal impacts such as property taxes, facility rental, etc. These are analyzed in Section 4.0.
[43] The measurement error is defined at the 95 percent confidence level and assumes random sampling.
[44] Each respondent was asked about how many people he/she was answering the survey on behalf of. In other words, if the respondent was traveling with her spouse and two children and answered spending questions on their behalf, the party size is 4.
[45] These fiscal impacts do not include any allocated fiscal impacts such as property taxes, facility rental, etc. These are analyzed in Section 4.0.
[46] The measurement error is defined at the 95 percent confidence level and assumes random sampling.
[47] Each respondent was asked about how many people he/she was answering the survey on behalf of. In other words, if the respondent was traveling with her spouse and two children and answered spending questions on their behalf, the party size is 4.
[48] These fiscal impacts do not include any allocated fiscal impacts such as property taxes, facility rental, etc. These are analyzed in Section 4.0.
[49] The measurement error is defined at the 95 percent confidence level and assumes random sampling.
[50] Each respondent was asked about how many people he/she was answering the survey on behalf of. In other words, if the respondent was traveling with her spouse and two children and answered spending questions on their behalf, the party size is 4.
[51] These fiscal impacts do not include any allocated fiscal impacts such as property taxes, facility rental, etc. These are analyzed in Section 4.0.
[52] The measurement error is defined at the 95 percent confidence level and assumes random sampling.
[53] Each respondent was asked about how many people he/she was answering the survey on behalf of. In other words, if the respondent was traveling with her spouse and two children and answered spending questions on their behalf, the party size is 4.
[54] These fiscal impacts do not include any allocated fiscal impacts such as property taxes, facility rental, etc. These are analyzed in Section 4.0.
[55] The measurement error is defined at the 95 percent confidence level and assumes random sampling.
[56] Each respondent was asked about how many people he/she was answering the survey on behalf of. In other words, if the respondent was traveling with her spouse and two children and answered spending questions on their behalf, the party size is 4.
[57] These fiscal impacts do not include any allocated fiscal impacts such as property taxes, facility rental, etc. These are analyzed in Section 4.0.
[58] The measurement error is defined at the 95 percent confidence level and assumes random sampling.
[59] Each respondent was asked about how many people he/she was answering the survey on behalf of. In other words, if the respondent was traveling with her spouse and two children and answered spending questions on their behalf, the party size is 4.
[60] These fiscal impacts do not include any allocated fiscal impacts such as property taxes, facility rental, etc. These are analyzed in Section 4.0.
[61] The measurement error is defined at the 95 percent confidence level and assumes random sampling.
[62] Each respondent was asked about how many people he/she was answering the survey on behalf of. In other words, if the respondent was traveling with her spouse and two children and answered spending questions on their behalf, the party size is 4.
[63] This is based on the average taxes collected compared with spending that takes place within the three jurisdictions.
[64] These fiscal impacts do not include any allocated fiscal impacts such as property taxes, facility rental, etc. These are analyzed in Section 4.0.
[65] The measurement error is defined at the 95 percent confidence level and assumes random sampling.
[66] Each respondent was asked about how many people he/she was answering the survey on behalf of. In other words, if the respondent was traveling with her spouse and two children and answered spending questions on their behalf, the party size is 4.
[67] This is based on the average taxes collected compared with spending that takes place within the three jurisdictions.
[68] These fiscal impacts do not include any allocated fiscal impacts such as property taxes, facility rental, etc. These are analyzed in Section 4.0.
[69] The measurement error is defined at the 95 percent confidence level and assumes random sampling.
[70] Each respondent was asked about how many people he/she was answering the survey on behalf of. In other words, if the respondent was traveling with her spouse and two children and answered spending questions on their behalf, the party size is 4.
[71] These fiscal impacts do not include any allocated fiscal impacts such as property taxes, facility rental, etc. These are analyzed in Section 4.0.
[72] The fiscal year runs from April through March.
[73] This includes the 2020 fiscal year (April 2020 – March 2021) that essentially resulted in zero events and visitors due to the COVID-19 pandemic. The pandemic hit the sports event and venue industry particularly hard compared to the rest of the economy.
[74] For instance, the 2004 NCAA Men’s Final Four basketball tournament economic impact analysis reported that approximately 20 percent of visitors said that coming to San Antonio for the Final Four would make them come some other time in the future.
[75] Much of the value of psychic impact is a “public good” meaning that its consumption is non-excludable and non-rival. In general, public goods are funded by governments in the appropriate jurisdiction (e.g., parks, national defense). Because these benefits derive from externalities, no private investor could hope to capture enough of the benefits to justify privately financed construction.